Swing Trend andSwing Highs & Lows
(Formerly Swings and SwingsHighsLows)
Swing Trend
(Formerly named Swings)
This indicator identifies swing points and trends in a zig-zag pattern. It also draws higher highs(HH), lower highs(LH), lower lows(LL), and higher lows(HL) text along with other swing data. Most of the swing data is exposed as a Data Series so it can be used in BloodHound. e.g. Swing duration, height, and percentage. Plus, various calculated price trends based on price action.
This indicator is derived from the PriceActionSwing indicator, and was written by Dorschden, a user of Futures.io. Because we did not create this indicator, we are unable to answer detailed or specific questions about its internal functionality. Those type of questions should be directed/asked on the PriceActionSwing discussion thread on Futures.io, where the author and community members can answer. This indicator is provided for free, and As-Is.
Historical vs. Real-time
Please note, this indicator does not detect reversal points in real-time as the zig-zag lines may appear to suggest. Price must move in the opposite direction for a few bars before the indicator can identify a reversal point. We suggest you watch this indicator on a fast moving range chart in real-time to understand how it operates in real-time.Properties
1. Parameters
These are the main settings that control how swing points are calculated.
Choose between Standard, Gann, Ticks, or Percent, as the formula which determines how a swing point is calculated and detected.
We do not have documentation on these settings, as the original author was Dorschden. The author did not provide any documentation.
This sets the sensitivity for identifying new swings. Typically use small values for lower time-frames, and larger values for higher time-frames.
IE: 1 is very sensitive and will create lots of small swing points. 7 is the default setting and is generally good for intraday charts. 14 is less sensitive and will identify larger swing points. For the Percent calculation type use much smaller values. See below.
Minimum value accepted: 0.00000001. The Percent calculation type will generally work best with a value below 1 (i.e. 0.25) for intraday charts.
Maximum value accepted: 1.79769313486232E+308. A more practical largest value to use is 25 for daily, weekly, or monthly charts.
Practical Values to Use
Intraday charts: Standard, Gann, or Ticks types is between 1 to 15. For Percent type is between 0.15 to 0.4.
Daily charts: Standard, Gann, or Ticks types is between 15 to 25. For Percent type is between 2 to 20.
This determines the maximum vertical range/distance that two swing highs or two swing lows can have in order to be considered a double top/bottom.
I.E. When two swing highs are this close in price, or closer, they are labeled a double top.
This number is a percent of the 14 period ATR value. The formula for calculating the range is ATR(14) * (DblTBStrength / 100).
The default prices used to calculate swing points are the High and Low bar prices. Enabling this option will use the Close price only.
2. Display Swing Data
The settings in this section determines what information is displayed as text on the chart, and the type of data displayed.
The Data Series output values (see the section below) are controlled by these settings. EG. If Show Duration is set to 'in Bars' the DataSeries SwingDuration will output the number of bars the swing lasted. If set to 'as MM:SS" the DataSeries SwingDuration will output the total number of seconds the swing lasted. If set to 'as HH:MM" the DataSeries SwingDuration will output the total number of minutes the swing lasted. All outputs are rounded to 1 decimal place. e.g. If the output is in minutes, then 1.4 is approximately 1 minute and 24 seconds.
3. Visual Characteristics
These settings change the visual style and look of the indicator on the chart. They have no effect when this indicator is used in BloodHound or BlackBird.
4. Gann Swings
These settings only apply when Swing calculation type is set to Gann.
Select if inside bars are ignored when using the Gann swing type. Only used if Swing Strength > 1.
Select if the Gann swings are updated if the last swing high/low is broken. Only used if Swing Strength > 1.
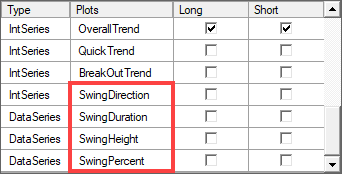
DataSeries Outputs
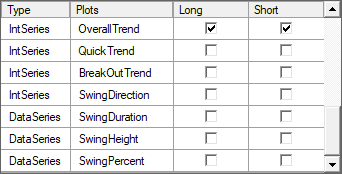
A DataSeries is a way to output data without plotting it on the chart. These DataSeries provide information about a swing as it is forming.
Please note: The data from the four Swing??? DataSeries does not exactly match the zig-zag lines drawn on the chart. The zig-zag lines are their to visually connect the swing point dots, but the lines do not tell you what bar a swing reversal was first detected. A swing reversal is not know until price moves a certain amount in the new swing direction, which typically takes several bars, but the lines always start drawing from the swing dots.
↗ A long trend is defined when one of the following occurs:
1) A higher low (HL) swing point followed by the high price breaking above the previous swing high (which means a higher high (HH) swing point is developing).
2) A double bottom followed by the high price breaking above the previous swing high (which means a HH swing point is developing).
3) A lower low (LL) is followed by a HH, and then a HL is established.
A long trend ends when the low price of a bar breaks below the previous swing low (which means a LL swing point is developing).
↘ A short trend is defined when one of the following occurs:
1) A lower high (LH) swing point followed by the low price breaking below the previous swing low (which means a lower low (LL) swing point is developing).
2) A double top followed by the low price breaking below the previous swing low (which means a LL swing point is developing).
3) A higher high (HH) is followed by a LL, and then a LH is established.
A short trend ends when the high price of a bar breaks above the previous swing high (which means a HH swing point is developing).
⇔ A neutral trend can occur when a HH swing point is followed by a LL swing point. Or, a LL is followed by a HH. Without a HL or LH, to confirm a HH or LL, a trend can not be confirmed.
This will be a +1 for an up trend, and a -1 for a down trend. A 0 (zero) means no trend direction.
↗ A long trend is defined when the high price breaks above the previous swing high, or a higher low swing point occurs.
↘ A short trend is defined when the low price breaks below the previous swing low, or a lower high swing point occurs.
A trend direction always exists.
This will be a +1 for an up trend, and a -1 for a down trend. A 0 (zero) means no trend direction was detected yet. This only occurs at the beginning of the chart before a trend direction is detected.
The trend changes when price breaks the previous swing high or low.
↗ A long trend is defined when the high price breaks above the previous swing high.
↘ A short trend is defined when the low price breaks below the previous swing low.
A trend direction always exists.
This will be a +1 for an up trend, and a -1 for a down trend. A 0 (zero) means no trend direction was detected yet. This only occurs at the beginning of the chart before a trend direction is detected.
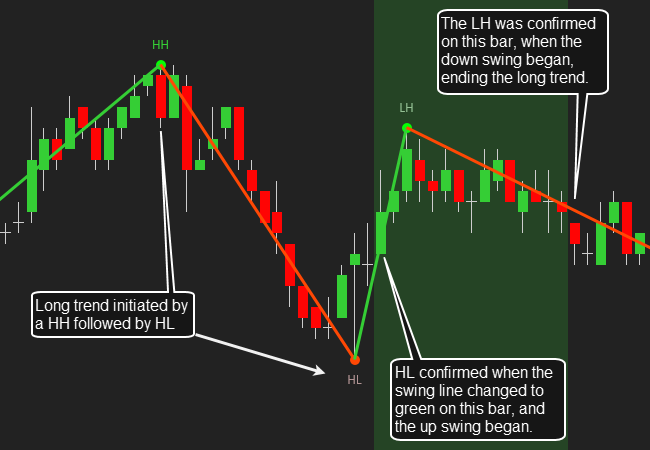
The trend changes when a higher high (HH) is followed by a higher low (HL), or a lower low (LL) is followed by a lower high (LH).
↗ A long trend is defined when a HH occurs, and next a HL is confirmed(locked in) when an upward swing direction begins.
The long trend will end if a LH is confirmed.
↘ A short trend is defined when a LL occurs, and next a LH is confirmed when a downward swing direction begins.
The short trend will end if a HL is confirmed.
The output value will be a +1 for an up trend, and a -1 for a down trend. A 0 (zero) means no trend direction was detected or the trend was broken.
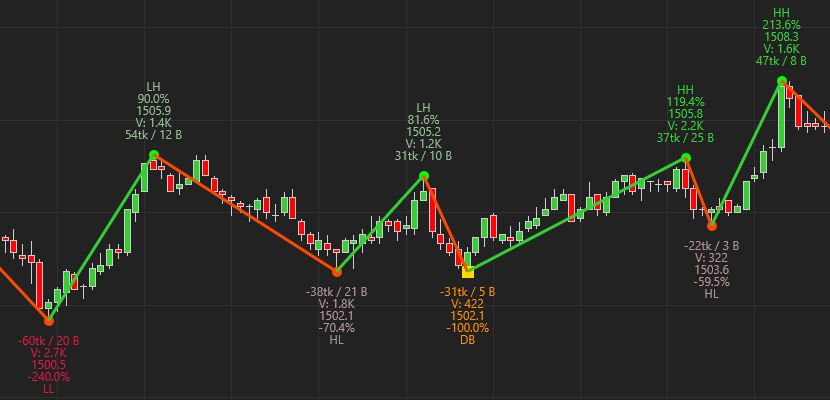
Chart example.
This will be a +1 for an up swing direction, and a -1 for a down swing. A 0 (zero) means no swing direction detected yet. This only occurs at the beginning of the chart before a swing direction is detected.
The duration can be measured in number of bars, or as time. The 2. Display Swing Data » Show Duration setting selects whether this data will be bars or time.
The height can be measured in ticks, points, or as a percentage. The 2. Display Swing Data » Show Length setting (shown above) selects whether this data will be ticks, points, price, or percentage. Using the SwingPercent DataSeries would be a better choice for percentage data.
The SwingPercent outputs the percentage of the current swing's length as compared to the previous swing length. The previous swing length is the base length. The value is rounded to 1 decimal place.
Video
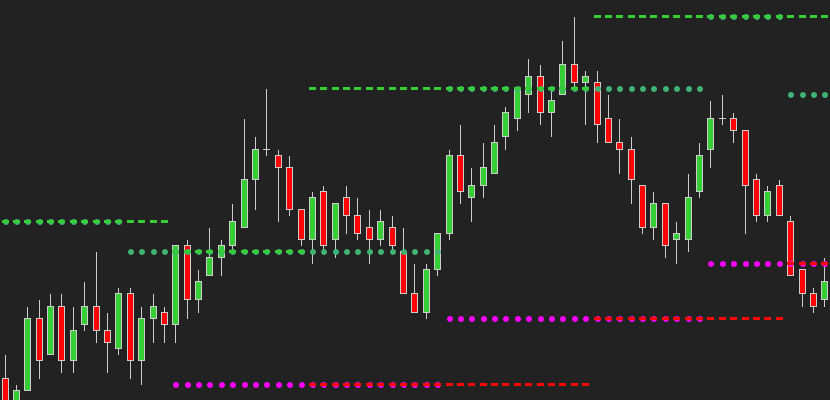
Swing Highs & Lows
(Formerly named SwingsHighsLows)
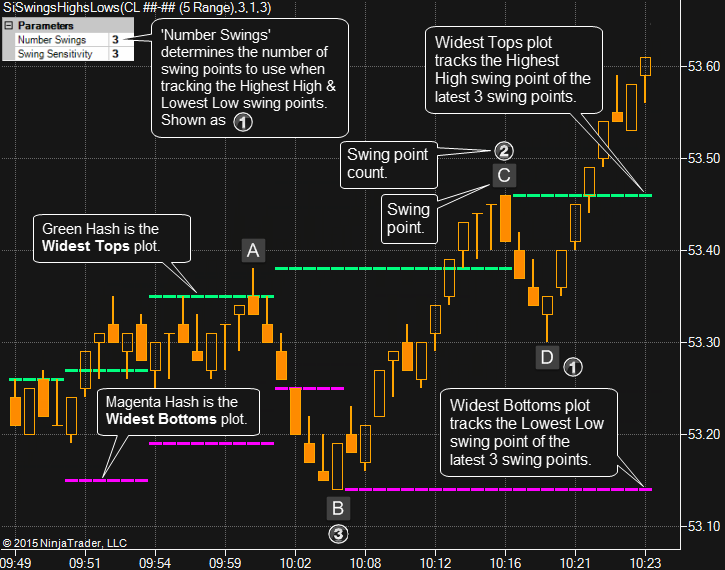
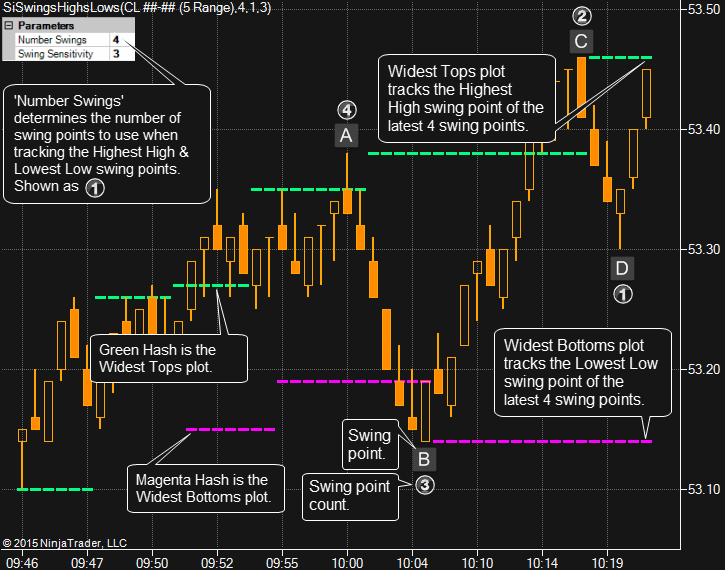
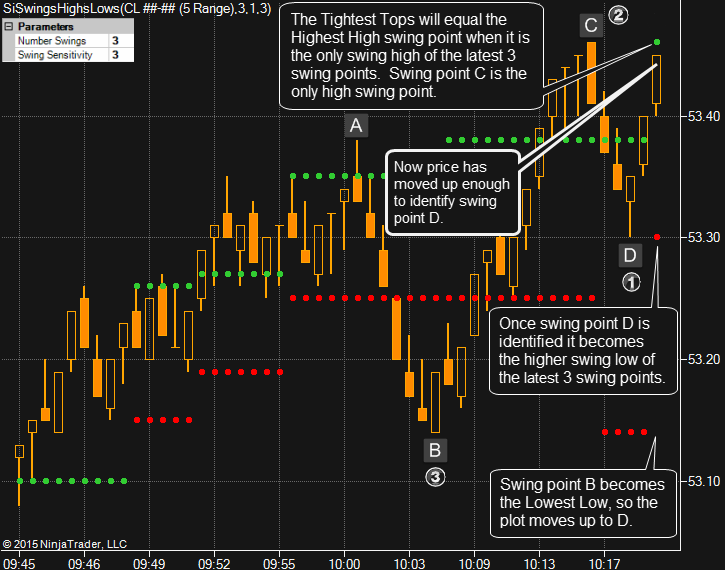
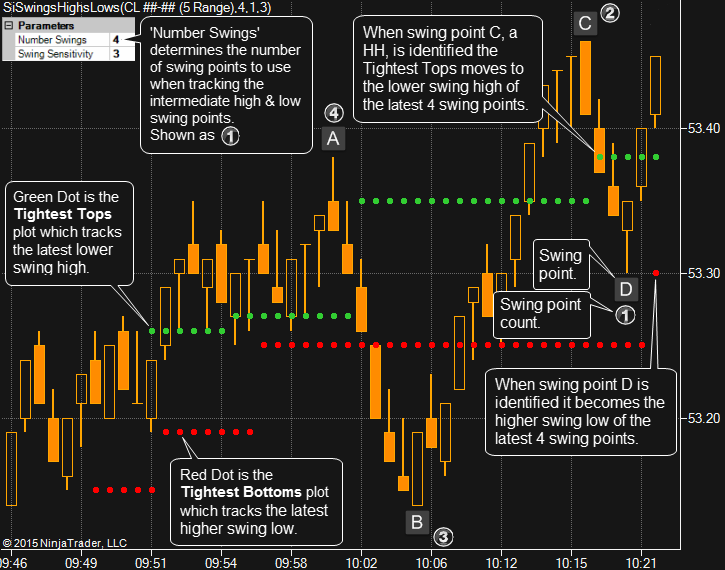
This indicator plots the swing points of the Swing Trend indicator(listed above), as horizontal price lines. The highest high (HH) , lowest low (LL) , lower high (LH) , and higher low (HL) swing points are each plotted separately for more control in BloodHound. The HH and LL are drawn by the Widest plots, and the intermediate LH & HL swing points are drawn by the Tightest plots.
This indicator is based on the PriceActionSwing (Swing Trend) indicator, and was originally written by Dorschden, a user of Futures.io. Because SharkIndicators did not create the PriceActionSwing indicator, we are unable to answer detailed or specific questions about its functionality. Those type of questions should be directed/asked on the PriceActionSwing discussion thread on Futures.io, where the author and community members can answer. This indicator is provided for free, and As-Is.
Properties
1. Parameters
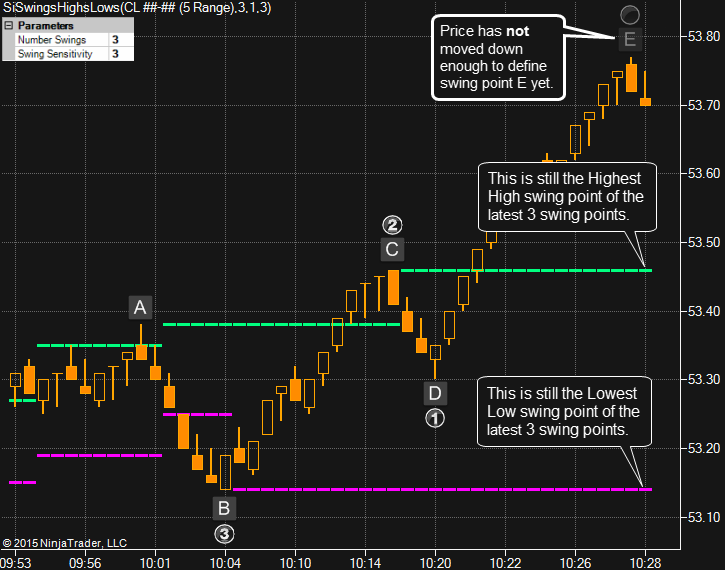
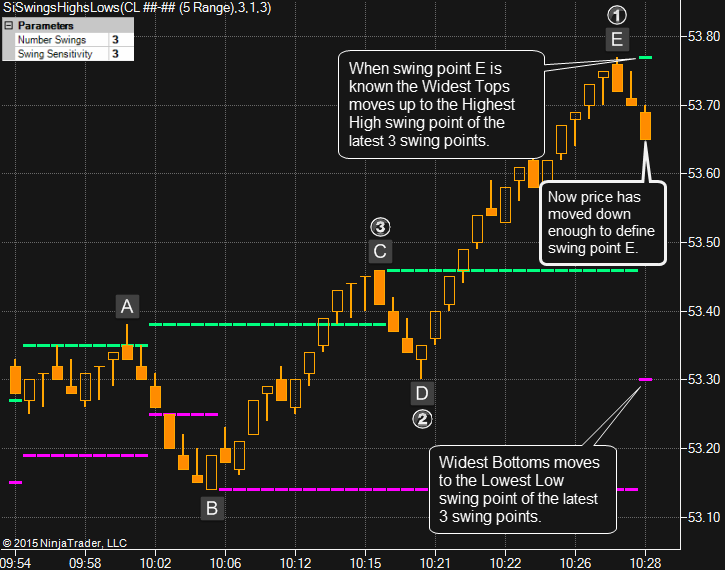
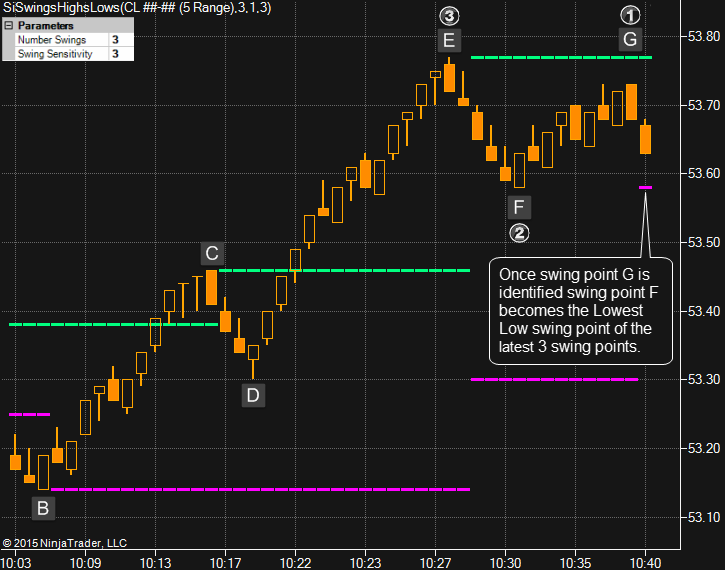
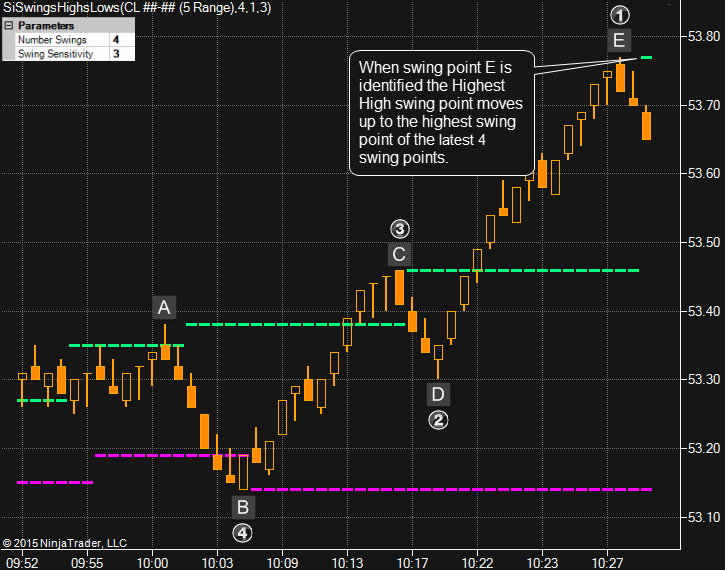
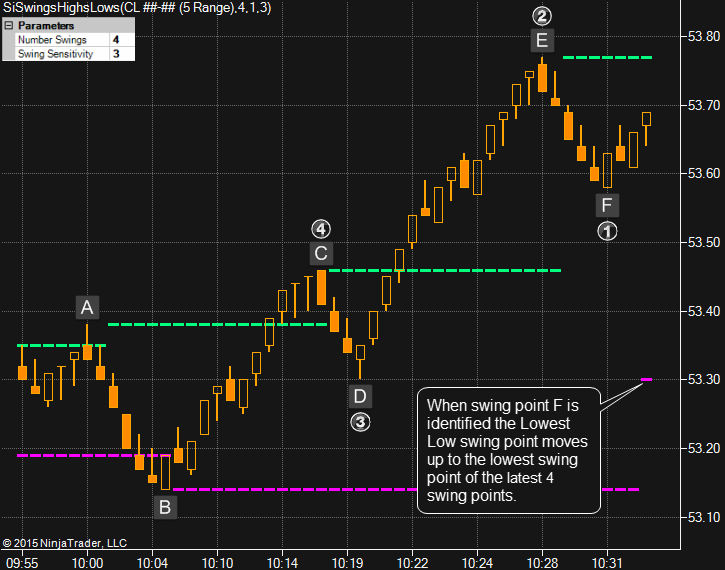
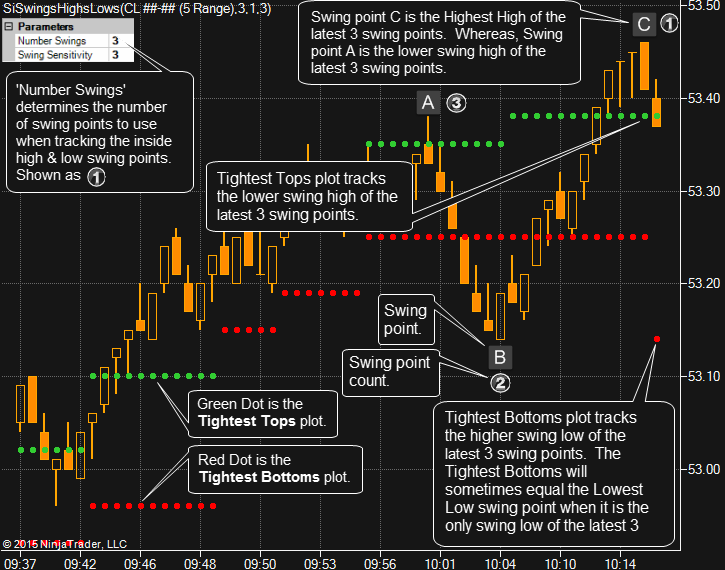
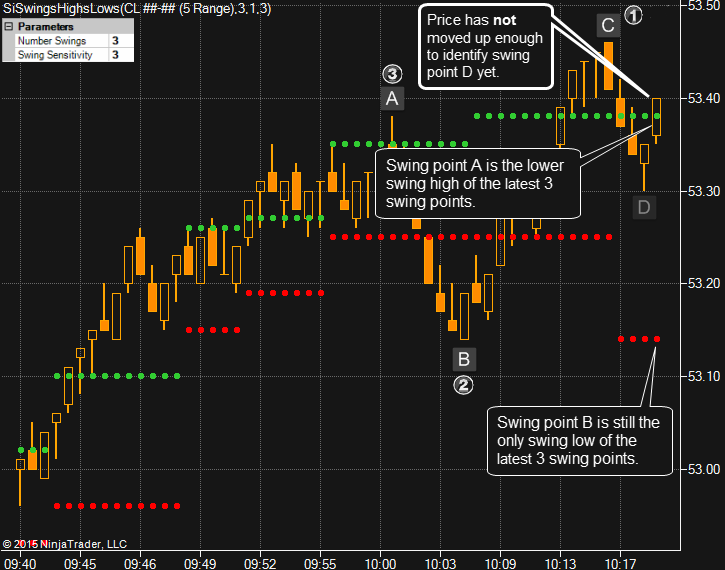
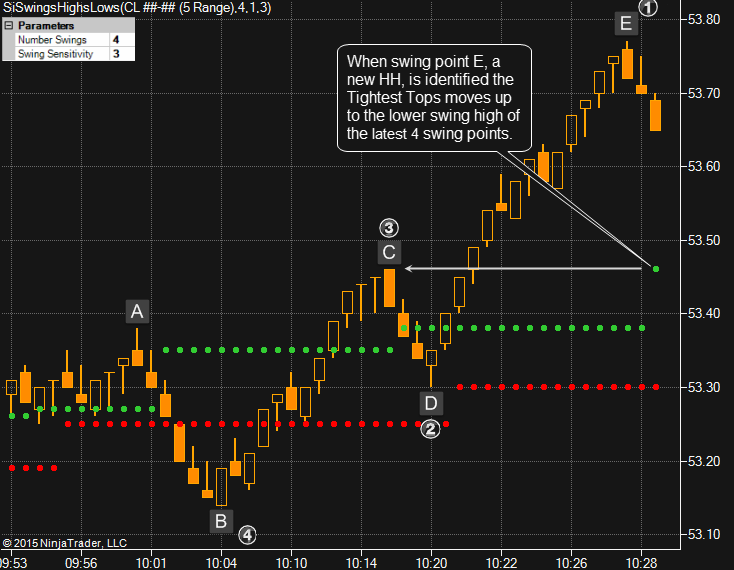
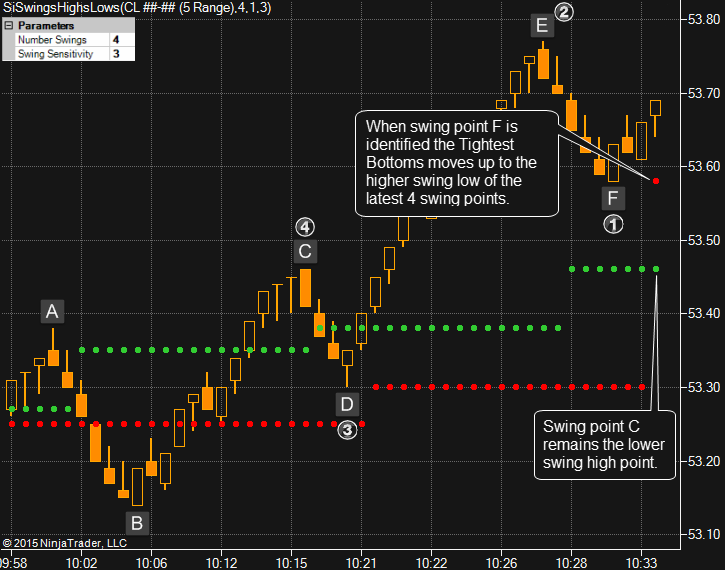
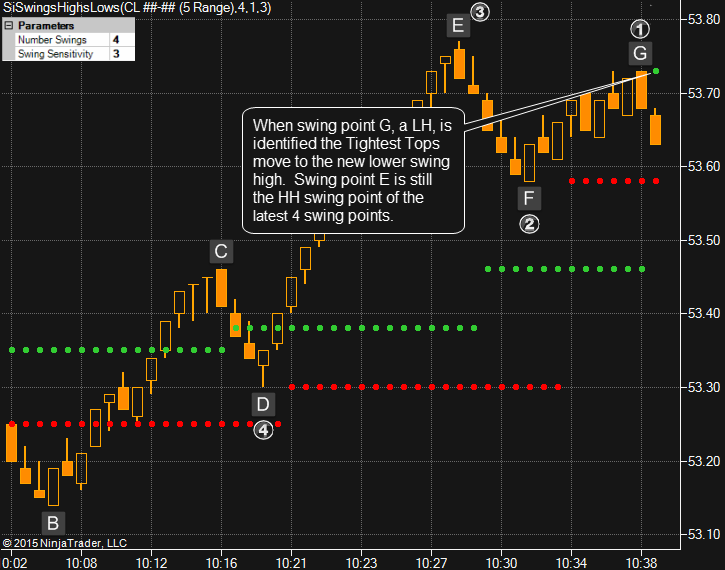
This sets the number of swing points to look back to find the highest high & lowest low swing point. The indicator must be given a limit to the number of swing points it will look back to find the highest high & lowest low swing points. See the examples and illustrations below for a visual explanation. Note, different Number of Swings are used.
The other parameter settings come from the Swing Trend indicator. See the Swing Trend settings above.
Plots
This image explains the plot naming convention. 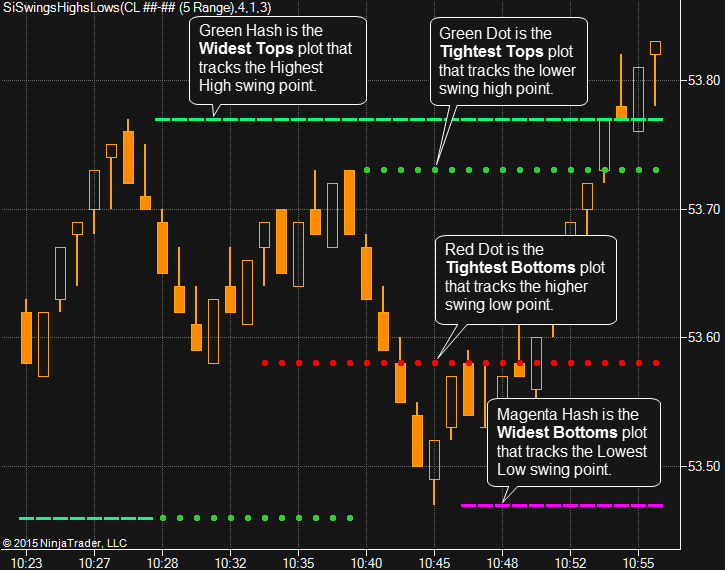
Widest Plots
Tightest Plots
Acknowledgement
The Swings(NT7) and Swing Trend(NT8) indicators (from PriceActionSwings) was written by Dorschden, a user of Futures.io (formerly bigmiketrading.com). We have been given permission to include with BloodHound as a free indicator. The functionality is As-Is, per Dorschden's design. Some unnecessary sections of the indicator’s code is commented out to improve performance when used with BloodHound.
If either of these indicators provides value in your trading, please consider donating, per Dorschden's request, to 
Requests for changes to these indicators should be directed to the original author Dorschden on Futures.io. The original indicator name is PriceActionSwing. We do not take requests to modify, nor do we resell, other sourced indicators.