
Support Resistance Solver

The Support Resistance solver evaluates the proximity of price to a support/resistance line, that is selected by the 'Select Type for S/R Line' settings. This solver can evaluation support/resistance (S/R) in two opposing modes. Headwind or Tailwind. Headwind mode identifies if there is enough clearance/room to trade towards an S/R line. The closer price gets to S/R the more "headwind" it encounters, and thus it is less desirable to trade in that direction. Tailwind mode identifies if price is close or near enough to S/R for a possible bounce away from it. Bounce trades near S/R are more desirable, because a S/R line can act as a tailwind pushing price away.
BloodHound v2
Properties tab
Properties tab
This section provides quick access to commonly used output modifiers.
Please note: The buttons only modify the individual instance of the selected node(s) on a Logic Board. Thus, the buttons are only visible when a node is selected on the Logic Board. The buttons are not available when a solver is selected in the Solvers panel, because the original solver's output can not be globally modified.
This behavior is consistent with adding a function node afterwards, so that the original solver's output remains unmodified elsewhere in the system. It is similar to having an SMA(50) on several charts. Changing the plot color on one chart does not modify the plot color on the other charts.
Global Properties
Global Properties
Behavior
Options
Input
Distance Targets
Output
Options tab
Options tab
This section is used to modify the node's final output value. It is only useful for designing fuzzy logic systems, or a fuzzy logic section of a system.
Please note: The Weight controls only modify the individual instance of the selected node(s) on a Logic Board. Thus, the Weight controls are only visible when a node is selected on the Logic Board. The controls are not available when a solver is selected in the Solvers panel, because the original solver's output can not be globally modified.
This behavior is different than BloodHound 1.0. In BH 1.0, the Weight controls modified the nodes output globally (every instance). This change in BH 2.0 adds more system design granularity.
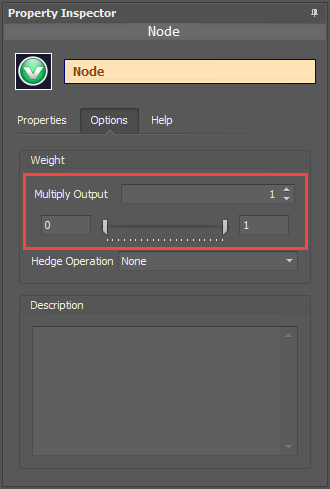 Multiply Output: This takes the internal values (the Long and Short values determined via the Properties tab » Output Rules section) and multiplies them by this value. Note: the final output will not exceed a value of 1, as described in the Slider control below.
Slider control: The slider constrains the final output to a value of 0 to 1. The left side of the slider sets a minimum value that is output regardless if the solver condition is true or not. The right side sets a maximum value that is output. The output is capped.
e.g. Three indicator conditions are being checked, and thus three solvers are created. Only two out of the three indicator conditions are needed. An Additive logic node is used to add the solver's outputs together. Just two out of the three solvers need to add up to a value of 1. Therefore, the right slider (max output value) for all three solvers is set to 0.5. When two indicator/solver conditions are found, thus the outputs = 0.5, then the calculation, in the Additive node, is 0.5 + 0.5 + 0 = 1. A value of 1 means the two out of three condition is true.
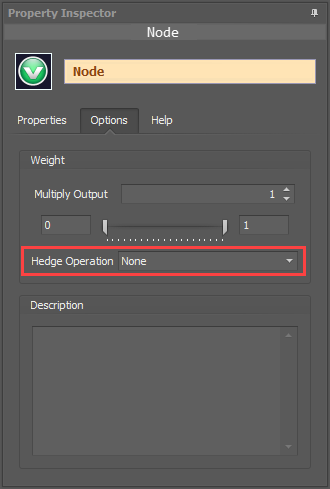 Hedge Operation: This applies a mathematical formula to the internal value.
None: No modification is applied.
Very (square output): A squaring formula is applied. Output = value^² .
Somewhat (square root output): A square root formula is applied. Output = √value .
Description
Description
This text area provides a place to write a full description of what the node is doing, used for, or what ever you want.
Note: The Description is global to all instances of the node. It is not applied individually to each instance as the Weight controls are.
Help tab
Help tab
This tab displays the documentation page (from this web site) of the selected node.
Please note: NinjaTrader v8.0.26.0 or newer is required for the built in web viewer to work, and thus the documentation to be displayed.
Video Tutorial
This video is from our weekly Workshop titled Revisiting the Support Resistance solver, on Oct 4th, 2013.
For more benefit please watch in full screen mode, as this video is recorded in HD.
Examples
Example 1A: The Basics of Headwind
This demonstrates the basic function of Support Resistance solver in Headwind mode. This Solver will be used with a EMA 100, acting as support/resistance, to detect a distance of at least 30 ticks to the support/resistance line. This could be used to validate there is enough distance to take a trade Long toward resistance or Short toward support.

- Add the Support Resistance solver
- Set Must Agree with Swing Trend to False
- Set Use Indicator to True
- Set Indicator to EMA 100
- Set Minimum Distance to 2 Ticks
- Set Ideal Distance to 30 Ticks
- Set No Sup/Res to 0
Note in these charts that the Long & Short Threshold in the Signals Properties are set to 0.99. A signal is given when price is 30 ticks or more away from support or resistance.

Example 1B: The Basics of Tailwind
This demonstrates the basic function of Support Resistance solver in Tailwind mode. This Solver will be used with a EMA 100, acting as support/resistance, to detect when price is within 2 ticks of support or resistance. This could be used to detect a potential price bounce off of support or resistance.

- Add the Support Resistance solver
- Set Mode to Tailwind
- Set Must Agree with Swing Trend to False
- Set Use Indicator to True
- Set Indicator to EMA 100
- Set Ideal Distance to 2 Ticks
- Set Maximum Distance to 10 Ticks
- Set No Sup/Res to 0
The chart below shows a signal when price is within 2 ticks of the EMA 100.

Example 2A: Pivots and Headwind
This demonstrates the Support Resistance solver using Woodies Pivots in Headwind mode. When multiple support/resistance lines are used the Solver will generate Long & Short signals at the same time when price is between support and resistance. This could be used to validate there is enough distance to take a trade Long toward resistance or Short toward support.

- Add the Support Resistance solver
- Set Must Agree with Swing Trend to False
- Set Use Indicator to True
- Set Indicator to Woodies Pivots
- Set Minimum Distance to 2 Ticks
- Set Ideal Distance to 30 Ticks
- Set No Sup/Res to 0
Three conditions take place in the chart below. To the left a Long & Short is given indicating there is 30 ticks or more to the next support or resistance. In the middle, price breaks above the white pivot and give a Long indicating a clearance of 30 ticks or more to the next resistance pivot. To the right, price drops below the white pivot and the Short indicates there is 30 ticks or more to the lower support pivot.

Example 2B: Pivots and Tailwind
This demonstrates the Support Resistance solver using Woodies Pivots in Tailwind mode. When multiple support/resistance lines are used the Solver will generate Long signal when price is near support and has enough distance to above resistance. For a Short signal price has to be near resistance with enough distance to support below.

- Add the Support Resistance solver
- Set Mode to Tailwind
- Set Must Agree with Swing Trend to False
- Set Use Indicator to True
- Set Indicator to Woodies Pivots
- Set Minimum Distance to 2 Ticks
- Set Ideal Distance to 30 Ticks
- Set No Sup/Res to 0
As you can see in the chart, Tailwind mode is more suited for detecting possible bounces off support/resistance lines.

Example 2C: Breaking Out
This is an extension of the previous two examples. This shows the use of Output > No Sup/Res(breakout) when price penetrates the last support or resistance line in both Headwind and Tailwind mode.

- Add the Support Resistance solver
- Set Must Agree with Swing Trend to False
- Set Use Indicator to True
- Set Indicator to Woodies Pivots
- Set Minimum Distance to 2 Ticks
- Set Ideal Distance to 30 Ticks
- Set At Ideal Distance to 0

Tailwind mode

- Add the Support Resistance solver
- Set Mode to Tailwind
- Set Must Agree with Swing Trend to False
- Set Use Indicator to True
- Set Indicator to Woodies Pivots
- Set Minimum Distance to 2 Ticks
- Set Ideal Distance to 30 Ticks
- Set At Ideal Distance to 0

BloodHound v1
Support Resistance Solver
The Support Resistance solver evaluates the proximity of price to a support/resistance line. This solver can evaluation support/resistance (S/R) in two opposing modes. Headwind or Tailwind. Headwind mode identifies if there is enough clearance/room to trade towards an S/R line. The closer price gets to S/R the more "headwind" it encounters, and thus it is less desirable to trade in that direction. Tailwind mode identifies if price is close or near enough to S/R for a possible bounce away from it. Bounce trades near S/R are more desirable, because a S/R line can act as a tailwind pushing price away.
Parameters
Options
Input
Distance Targets
Output
Video Tutorial
This video is from our weekly Workshop titled Revisiting the Support Resistance solver, on Oct 4th, 2013.
For more benefit please watch in full screen mode, as this video is recorded in HD.
Examples
Example 1A: The Basics of Headwind
This demonstrates the basic function of Support Resistance solver in Headwind mode. This Solver will be used with a EMA 100, acting as support/resistance, to detect a distance of at least 30 ticks to the support/resistance line. This could be used to validate there is enough distance to take a trade Long toward resistance or Short toward support.
- Add the Support Resistance solver
- Set Must Agree with Swing Trend to False
- Set Use Indicator to True
- Set Indicator to EMA 100
- Set Minimum Distance to 2 Ticks
- Set Ideal Distance to 30 Ticks
- Set No Sup/Res to 0
Note in these charts that the Long & Short Threshold in the Signals Properties are set to 0.99. A signal is given when price is 30 ticks or more away from support or resistance.
Example 1B: The Basics of Tailwind
This demonstrates the basic function of Support Resistance solver in Tailwind mode. This Solver will be used with a EMA 100, acting as support/resistance, to detect when price is within 2 ticks of support or resistance. This could be used to detect a potential price bounce off of support or resistance.
- Add the Support Resistance solver
- Set Mode to Tailwind
- Set Must Agree with Swing Trend to False
- Set Use Indicator to True
- Set Indicator to EMA 100
- Set Ideal Distance to 2 Ticks
- Set Maximum Distance to 10 Ticks
- Set No Sup/Res to 0
The chart below shows a signal when price is within 2 ticks of the EMA 100.
Example 2A: Pivots and Headwind
This demonstrates the Support Resistance solver using Woodies Pivots in Headwind mode. When multiple support/resistance lines are used the Solver will generate Long & Short signals at the same time when price is between support and resistance. This could be used to validate there is enough distance to take a trade Long toward resistance or Short toward support.
- Add the Support Resistance solver
- Set Must Agree with Swing Trend to False
- Set Use Indicator to True
- Set Indicator to Woodies Pivots
- Set Minimum Distance to 2 Ticks
- Set Ideal Distance to 30 Ticks
- Set No Sup/Res to 0
Three conditions take place in the chart below. To the left a Long & Short is given indicating there is 30 ticks or more to the next support or resistance. In the middle, price breaks above the white pivot and give a Long indicating a clearance of 30 ticks or more to the next resistance pivot. To the right, price drops below the white pivot and the Short indicates there is 30 ticks or more to the lower support pivot.
Example 2B: Pivots and Tailwind
This demonstrates the Support Resistance solver using Woodies Pivots in Tailwind mode. When multiple support/resistance lines are used the Solver will generate Long signal when price is near support and has enough distance to above resistance. For a Short signal price has to be near resistance with enough distance to support below.
- Add the Support Resistance solver
- Set Mode to Tailwind
- Set Must Agree with Swing Trend to False
- Set Use Indicator to True
- Set Indicator to Woodies Pivots
- Set Minimum Distance to 2 Ticks
- Set Ideal Distance to 30 Ticks
- Set No Sup/Res to 0
As you can see in the chart, Tailwind mode is more suited for detecting possible bounces off support/resistance lines.
Example 2C: Breaking Out
This is an extension of the previous two examples. This shows the use of Output > No Sup/Res(breakout) when price penetrates the last support or resistance line in both Headwind and Tailwind mode.
- Add the Support Resistance solver
- Set Must Agree with Swing Trend to False
- Set Use Indicator to True
- Set Indicator to Woodies Pivots
- Set Minimum Distance to 2 Ticks
- Set Ideal Distance to 30 Ticks
- Set At Ideal Distance to 0
Tailwind mode
- Add the Support Resistance solver
- Set Mode to Tailwind
- Set Must Agree with Swing Trend to False
- Set Use Indicator to True
- Set Indicator to Woodies Pivots
- Set Minimum Distance to 2 Ticks
- Set Ideal Distance to 30 Ticks
- Set At Ideal Distance to 0