Cycles, Trends and Patterns – Finding a trading timeframe
Cycles exist in trends which are defined by wave cycles or patterns of smaller magnitude thus defining a cycle in a fractal form. In Dow Theory these cycles are defined as minor, intermediate and major. In Elliott Wave Theory the cycles are defined into even smaller cycles that define the Grand Super cycle. In essence, technical analysis recognizes that price moves in cycles and that those cycles are fractal in nature. That is to say that the patterns have pattern within the patterns.
The challenge we all face is finding a cycle that is well defined within a specific timeframe that meets our trading requirements and can generate profitable trades. We can choose to trade in large cycles comprising long timeframes or smaller cycles that are in the tick to minute per bar. Should it be ticks, minutes, hours or other longer timeframes? Are there any technical analysis tools that can help us in finding a trading timeframe or the cycle of a stock at a given periodicity.
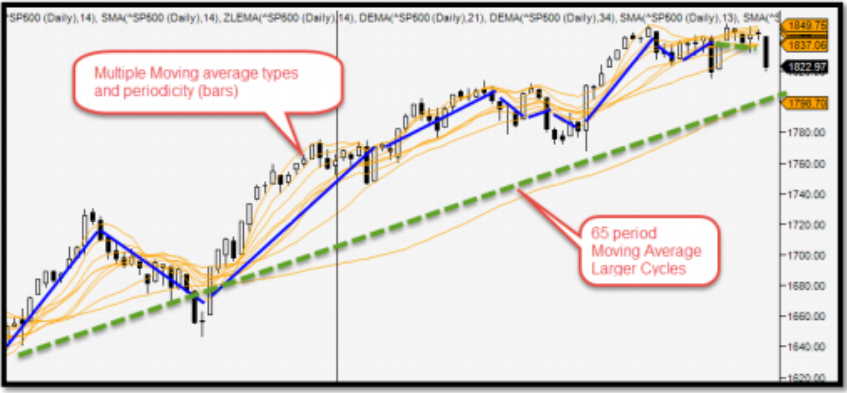
There are many ways in which we try to ascertain the cycle of instruments. A basic way is to use multiple moving averages. One of which is to look at different moving averages with different bar values. So we start with Simple Moving Averages like 13, 21, 34, 65, 240 bars and so on. Then we also use Exponential moving averages and so on. The bottom line is that we are trying to force a bar value to a cycle. Cycles are not defined in certain values. You can find some instrument that has a cycle of 24 bars, then followed by a 12 bar cycle and then a 50 bar cycle. If we look at the chart above with a number of moving averages we see long cycles, short cycles and a cycle (green bar) that is yet moving in a bullish bias. In essence, we find that the cycles are fractal in nature and do not adhere to a single value that can be used to measure repeating cycles.
I would like to propose that there is another way. If we take the raw market data and slice it into different cycles through algorithm(s), then we can extract a fractal value that can be plotted. Even though, we extract a cycle, we do not extract a singular cycle value that could be used in a moving average to ascertain cycles. In our algorithms, we let the market dictate the amplitude and frequency and we just interpret the values.
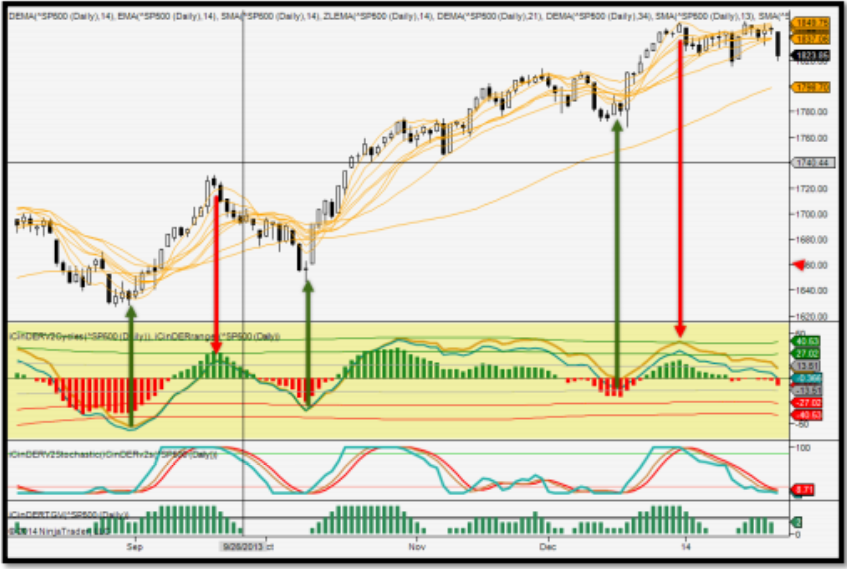
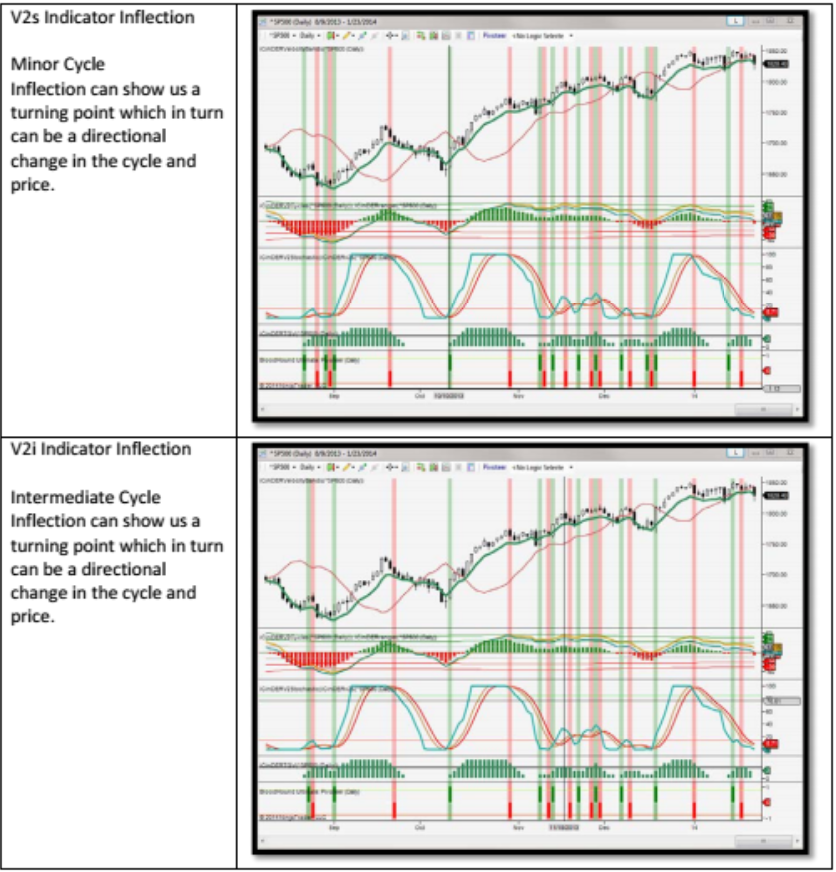
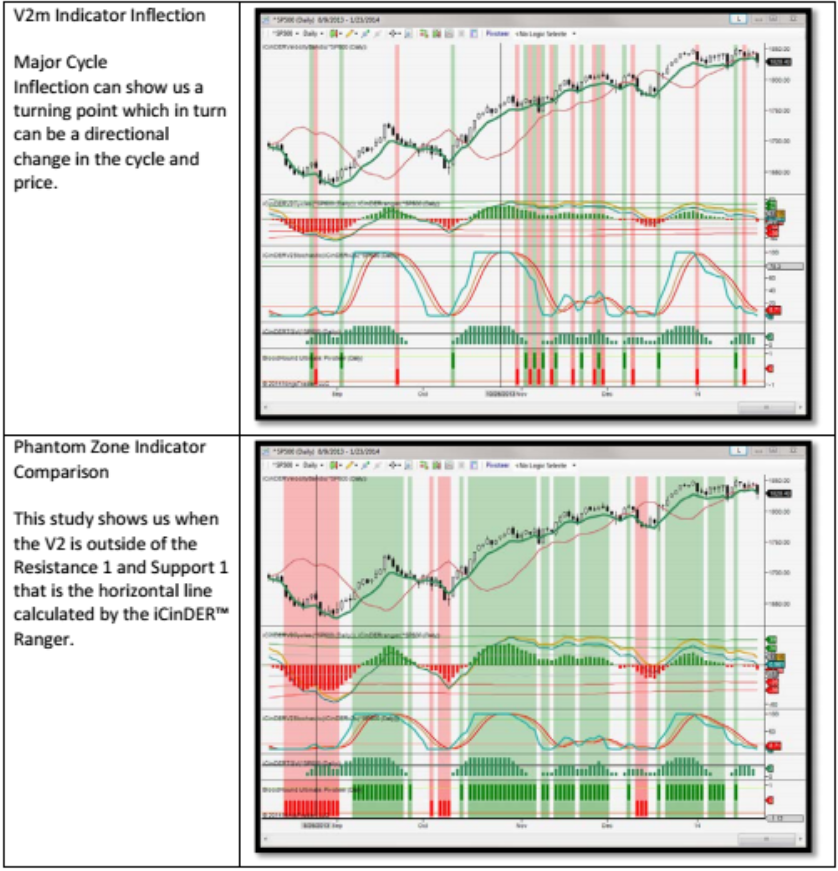
The iCinDERTM V2 Cycles extract the cycles at minor, intermediate and major periodicity and display the cycle as a sine wave or wavelet. By looking at the inflection points we can then ascertain the market movement with greater clarity. Our goal is to find the time where the V2 is at a high amplitude to help us find reversal points in market movement or individual stock. One of the rules of the cycle is that when the V2 is above zero the market is moving in a bullish bias and when the V2 is below zero, then the market is in a bearish bias. On the chart you also find horizontal lines , iCinDERTM Ranger, which help us evaluate the amplitude or strength of the market movement.
This this point, we can visually recognize the cycles by using the V2 Cycle indicators and we can trade based on the following some of the rules here:
- Cycles confirm when there is a crossover the zero line in the direction of the histogram or line.
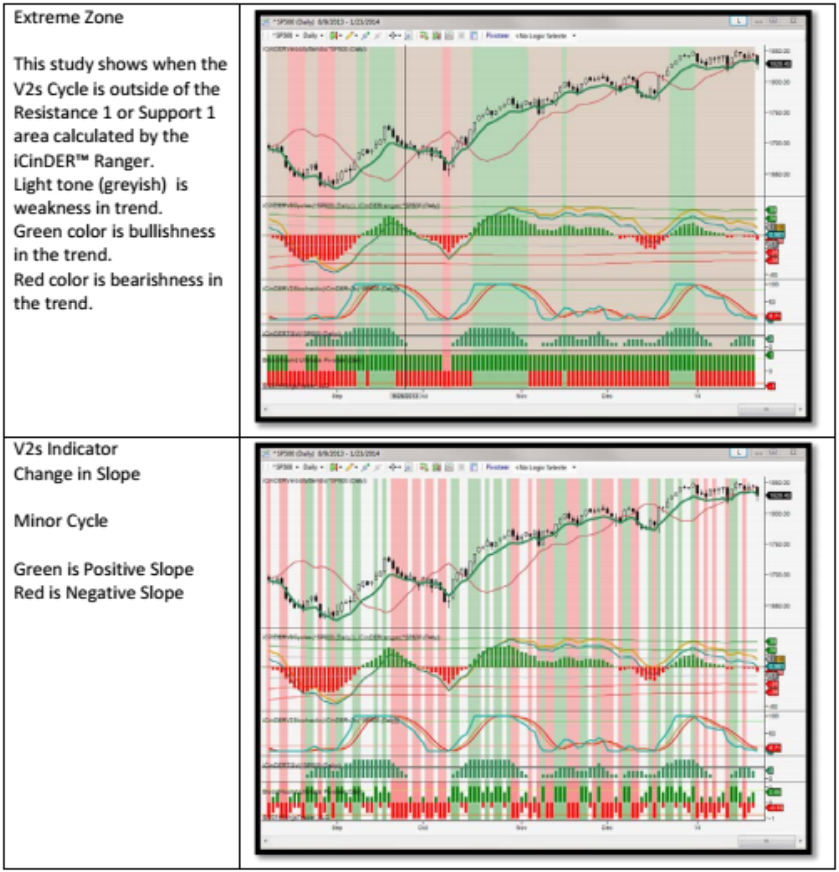
- Cycles have magnitude and we look for the Ranger horizontal lines to ascertain the cycle strength (amplitude) and we look for peaks and troughs that are touching or exceeding the iCinDERTM Ranger Resistance (R2, R3) or Support (S2, S3).
- We look for the V2 s (minor cycle) to stay above R2 or below S2. These are stronger moves.
- Moves in the R1-S1 range can likely be corrective patterns or continuation of a weakening trend.
- We can also use other indicators to help us find momentum, directional bias, etc.
With all this, we still have a challenge when day trading, that being, that the market can move fast and drastically in one direction or another. In reality, we need a system that can monitor our rule-set and tells us when all the rules are true or false. This leads us into the next phase, which is integrating Shark Indicator Bloodhound. With this tool we can set the rules and then watch for bullish or bearish confirmations.
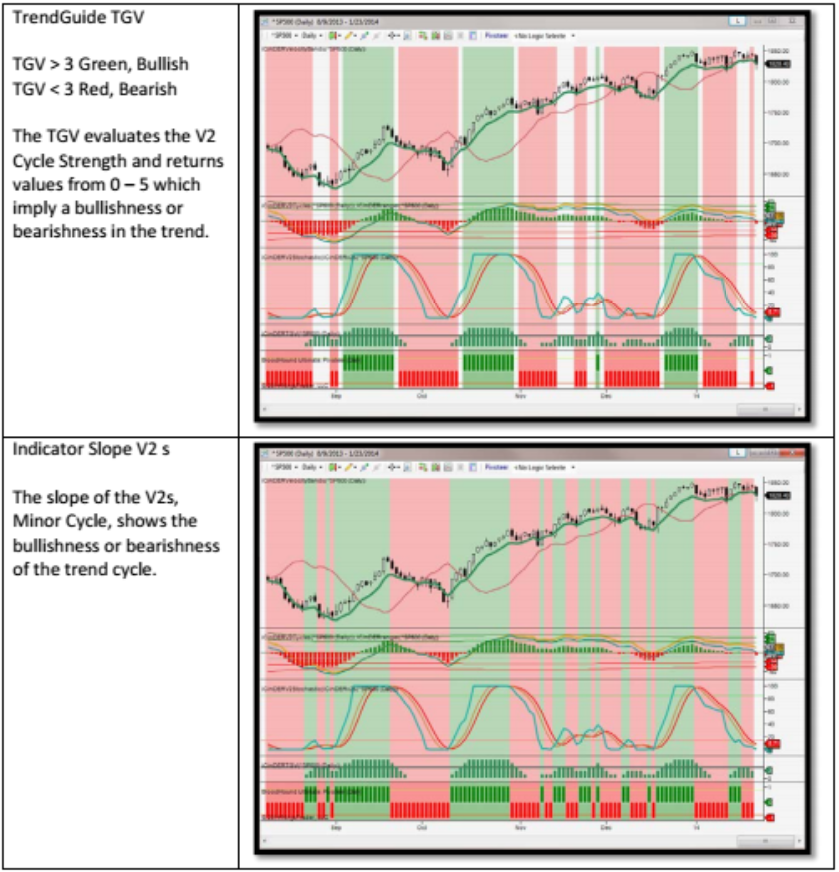
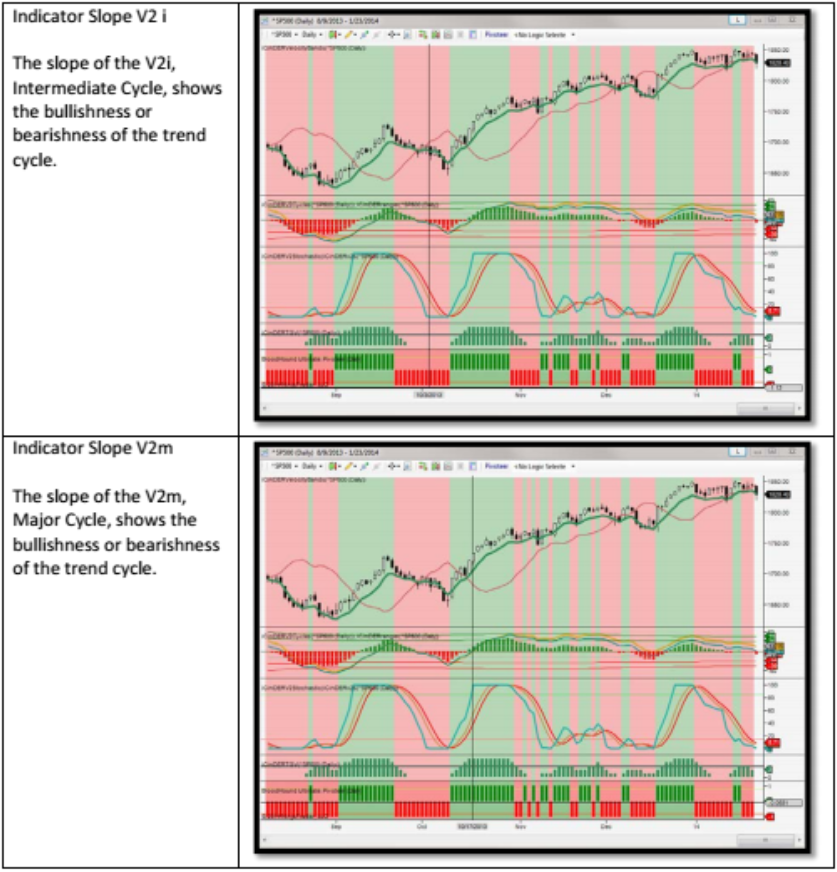
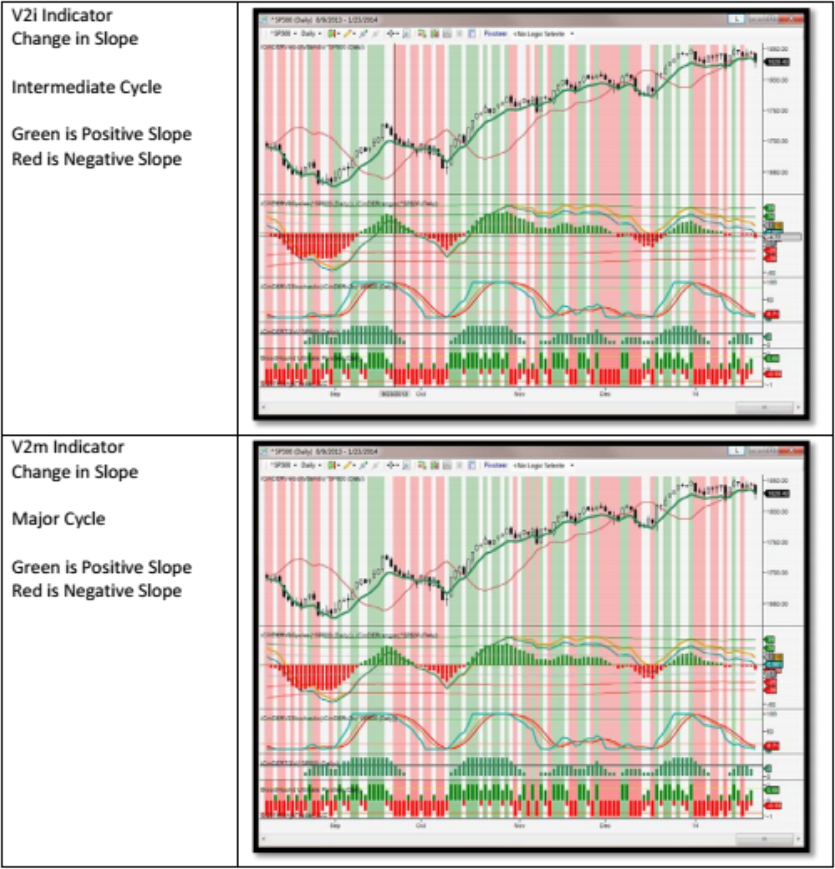
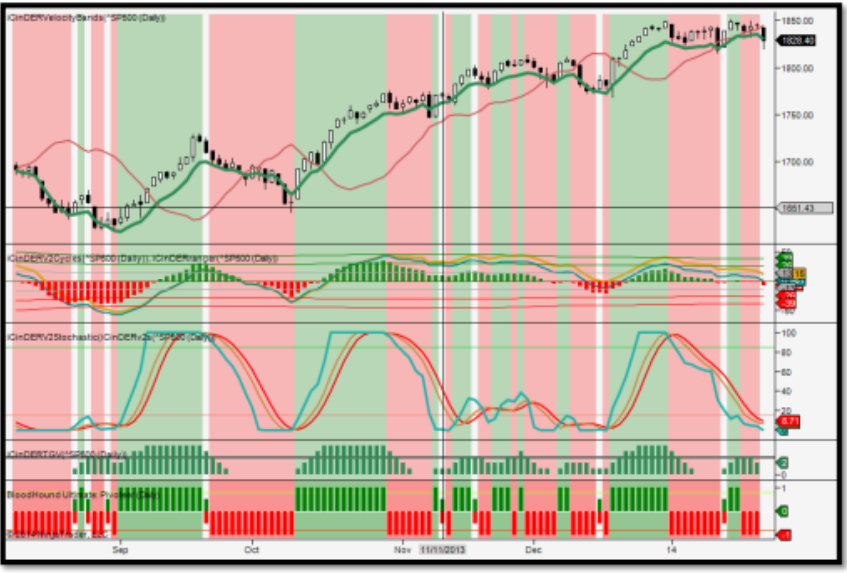 In this chart, we can see bullish bias in Green and Bearish bias in Red. The application of a rule which is based on indicator slope evaluation of the V2s (minor) and V2i (intermediate) cycles.
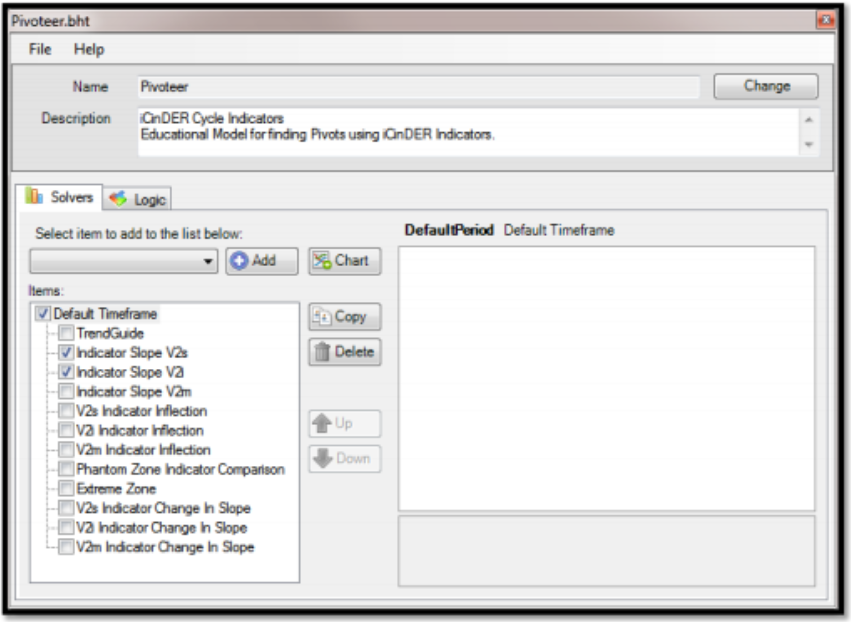
Using the Pivoteer.bht (Bloodhound template), you can visualize the effect of different cycle indicators as measure by slope, inflection, comparison, etc.
Here is the breakdown: