
The BloodHound Interface
BloodHound v2
Summary
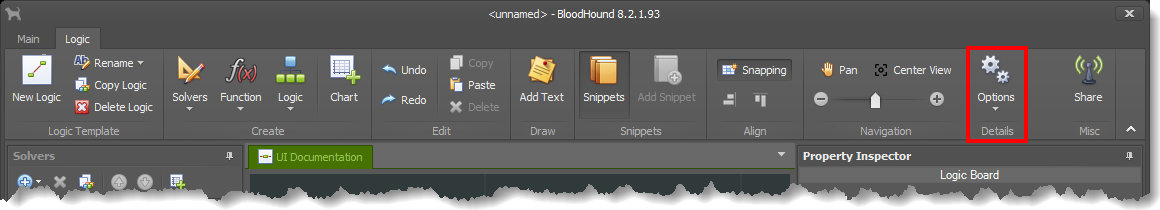
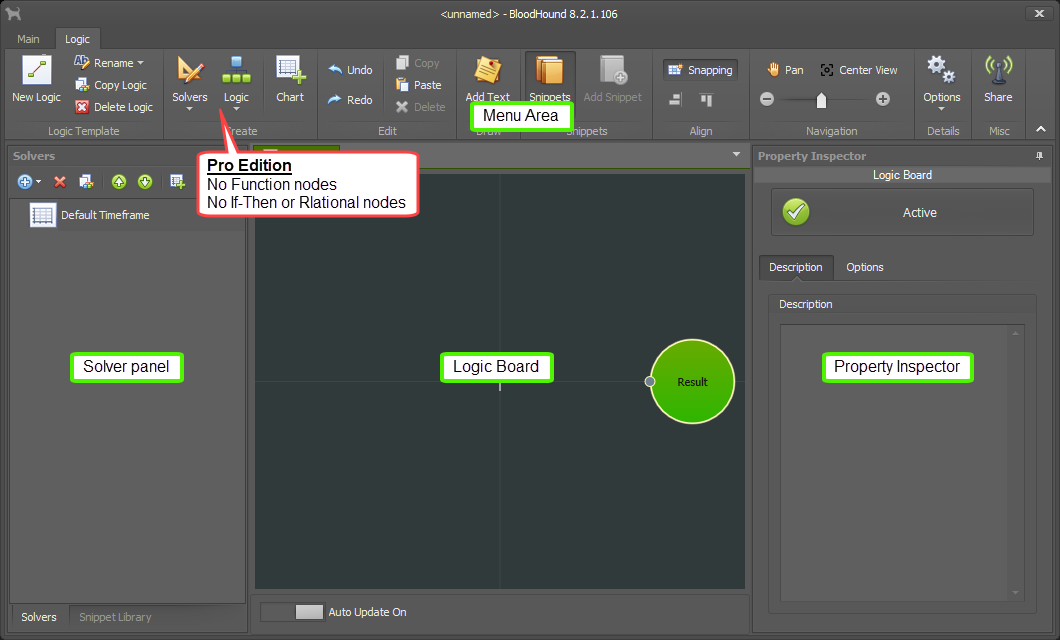
The interface consists of four main areas, as seen in this image. Clicking on the links below will scroll down to that section.
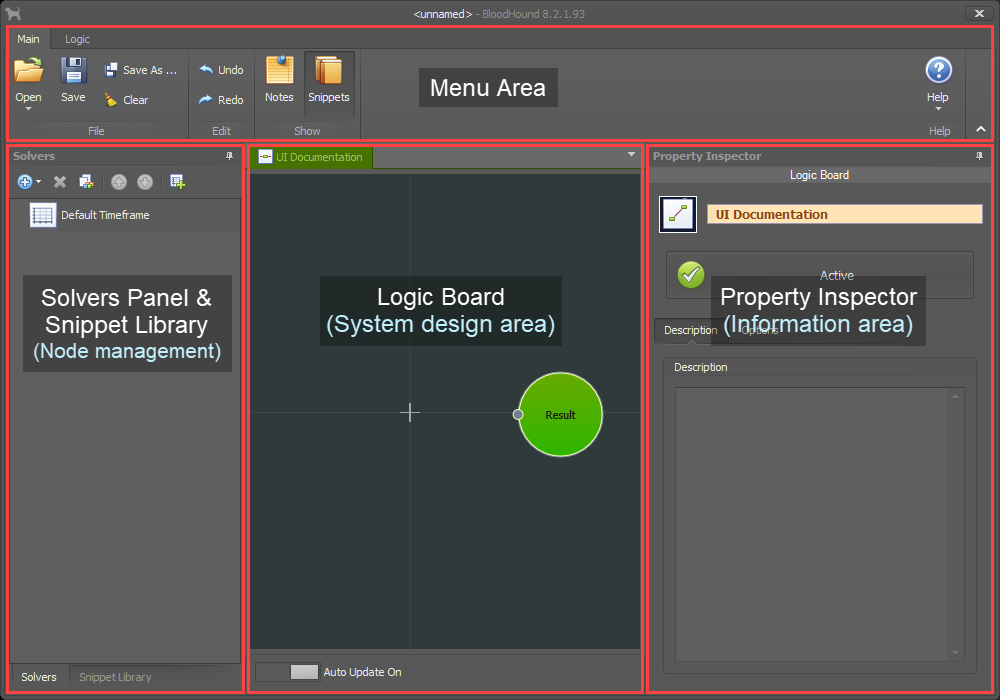
Menu area
The top area is a standard ribbon style menu. The File tab provides typical file management buttons for saving and opening your BloodHound files. The Logic tab has all the buttons for building a system, and navigating around in the Logic Board area.
Solvers panel & Snippet Library (Node management area)
This area on the right is two panels. The tabs, on the bottom of this area, switch between the list of system solvers, and your snippets library.
Logic Board (System design area)
This is the primary area that the BloodHound window is focused around. This is where systems are built, the design area. There are tabs at the top of this area for switching between Logic Templates. Logic Templates hold independent systems. e.g. The primary system is usually the Entry signals. A secondary system could be Exit signals. Or, a secondary system could be a derivative of the Entry signal for instruments with higher volatility in which case indicators used in the system need different settings to compensate for the higher volatility.
Property Inspector (Information area)
This panel displays information and settings of the selected node or chart. Nodes can be selected in the Logic Board or Solvers Panel.
Close window button. The "X"/Close button at the top right closes the interface window, and also saves to the file. Any action that causes the BloodHound window to close (i.e. anything that causes a chart reload) also causes an automatic save to ensure changes are not accidentally lost. This is similar to an autosave feature.
Closing the interface does not perform an automatic load check.
Introduction to the New Interface
Menu Area
Main Tab
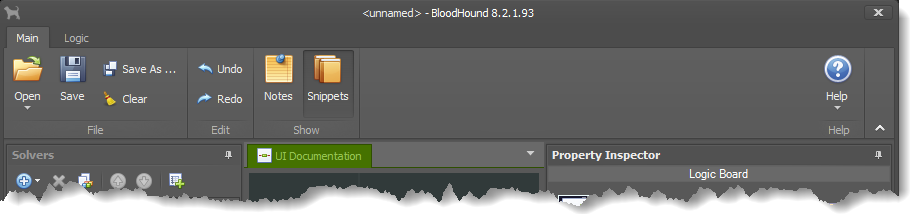
The Main tab has standard file management buttons, a few miscellaneous buttons, and the Help drop-down menu.
Buttons
File section: This is where you can open, save, save-as, or clear the contents to start a new system. BloodHound is unlike any indicator you have used before. Think of BloodHound similar to a Microsoft Excel spreadsheet. You fill the spreadsheet with formulas and data, and then save your work to a file so you can use the spreadsheet again at a later date. It is the same with BloodHound. You save your system to a (template) file so it can be used again after shutting down NinjaTrader.
Undo / Redo: This does not undo or redo file changes. It will undo or redo changes made in the Logic Board and Property Inspector areas.
Notes: This opens an area for writing a description and/or notes about the system, as a reminder. Clicking the button toggles the Notes tabe open or close.
Snippets: This button toggle the Snippets Library panel on or off. When the Snippets Library panel is toggled on, it also is brought forward and visible. The Snippets Library panel is on the left.
Help: This provides quick links to various training documents and videos, licensing management, and you can manually check for updates. BloodHound does automatically check for updates every few days.
Logic Tab
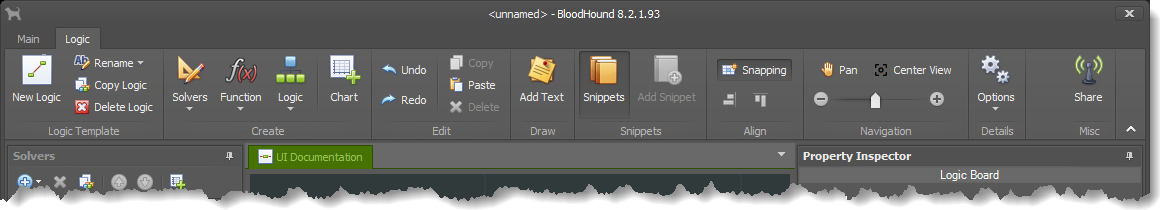
The Logic tab contains all the menu buttons for creating, editing, and navigation for building a BloodHound system.
Buttons
 Logic Template section: These buttons provide various editing functions to manipulate Logic templates.
These function are also available by right-clicking the mouse on a Logic Template tab.
New Logic: This adds a new logic template to the system.
Rename: This provides one of the ways to change the logic template name.
Copy Logic: This creates a copy of the currently visible logic template. Please note, the logic template copy uses the same solvers used in the original logic template. A new copy of the solver(s) is not created to save calculation resources. Changing a solver in the logic template copy will also change the original logic template.
Delete Logic: This deletes the visible logic template. Reminder, the Undo button can undelete the logic template.
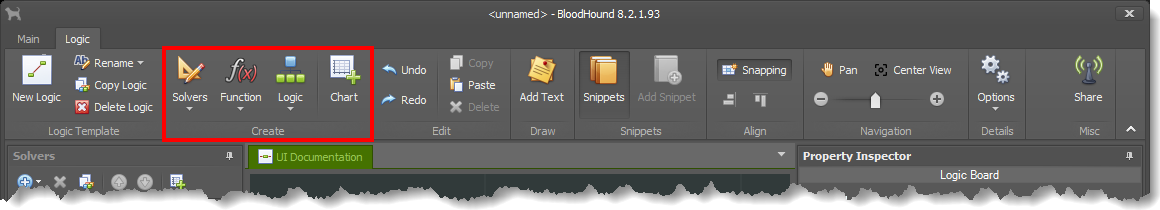 Create section: These buttons provide access to all the nodes used to create and build a system. Clicking on a node will add it to the center of the logic board. If a solver is selected it will also be added to the Solvers panel.
This menu is also available on the Logic board by right-clicking the mouse.
Solvers: This provides access to all the Solver nodes.
Function: This provides access to all the Function nodes.
Logic: This provides access to all the Logic nodes.
Chart: This provides a way to add secondary Data Series (chart data) to the Solvers panel, for developing a multi-timeframe system.
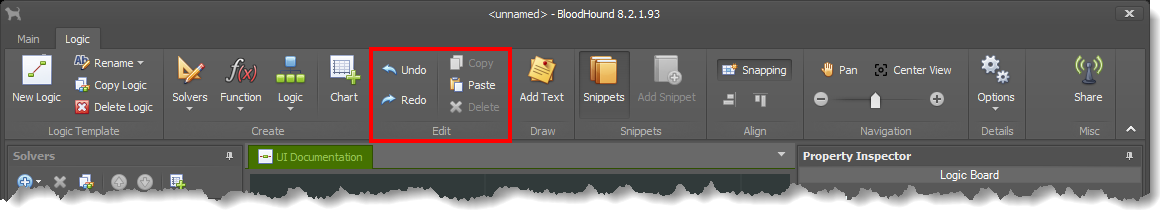 Edit section: These buttons provide various editing actions and functionality such as undo, copy & paste.
These functions are also available on the Logic board by right-clicking the mouse when a node(s) is selected.
Undo: The Undo function is used to reverse an action or change, such as deleting the wrong solver, or changing any of the settings of a node.
Redo: The Redo function restores any action that was previously undone using the Undo.
Copy: The Copy function copies any selected object(s) on the Logic Board to the Windows clip board as XML data. That XML data can then be pasted back to the same Logic Board or a different Logic Board.
Paste: The Paste function will paste the recently copied object(s) to the currently visible Logic Board.
Delete: The Delete function deletes Function and Logic nodes from the Logic Board, but only removes a Solver node. To delete a solver it must be deleted from the Solvers panel.
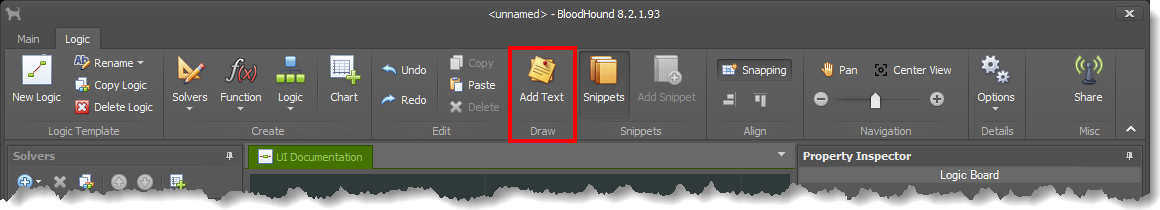 Add Text button: This button is used to add a text box to the Logic Board work area, allowing for notes and descriptions. Use the Property Inspector panel to edit the text, and change the color of various elements.

 Snippets section: These buttons are used to enable/disable the Snippet Library panel (more info in the Snippet Library section below), and add/create a new snippet to your library. Snippets are re-useable groups or single nodes. This provides an easy way to access system nodes or portions of a system that are used over and over again. See the Snippet Library pane for more detailed info.
e.g. If you have a favorite solver or group of solvers for filtering signals, it can be saved as a snippet. Then, when designing a new system, that filter can easily be inserted in with one click and a mouse drag.
Snippets: This button toggle the Snippets Library panel on or off. When the Snippets Library panel is toggled on, it also is brought forward and visible. The Snippets Library panel is on the left.
Add Snippet: This button creates a snippet from the nodes selected in the Logic Board. The button is disabled when no nodes are selected. Snippets are visible in the Snippet Library panel.
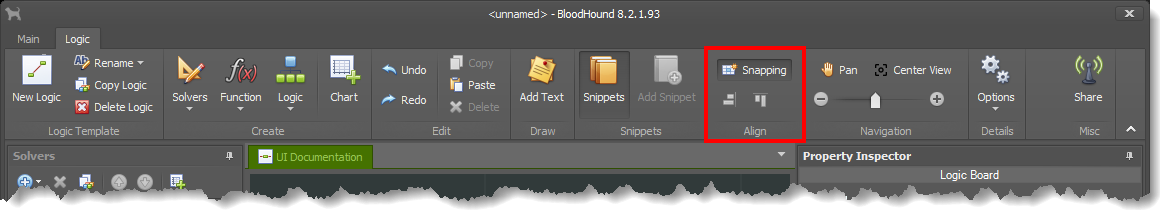 Align section: These buttons are used for aligning nodes on the Logic Board to create an orderly layout and alignment of the nodes.
Snapping: This button toggles the snapping function on or off.
Align Right: This button aligns all the selected nodes horizontally to the right edge (the Output connector). Two or more nodes must be selected
Align Top: This button aligns all the selected nodes vertically along the top edge. Two or more nodes must be selected
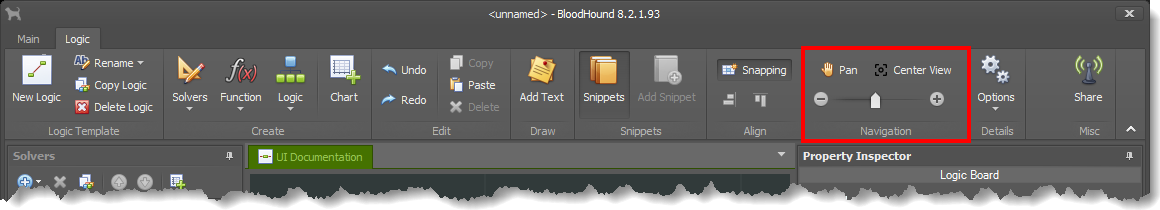
Navigation section: These buttons are used to maneuver around the Logic Board. Large systems, having many nodes, may require zooming in and out, and panning around to see the whole system.
Pan: The Pan button toggle the Pan function on or off. When on, the mouse can only be used to pan around the Logic Board. The Pan function allows the Logic Board view to be moved up or down, and side to side. If the scroll wheel on your mouse can be pressed, that enables the pan function while pressed.
Center View: This button has different zoom behavior modes depending if nodes are selected or not.
When no node is selected, the zoom level and pan automatically adjusts the viewing area to show all nodes.
When node(s) is/are selected, the view is centered and zoom level adjusted to the selected nodes. A second click will zoom out to all nodes.
⊝ Zoom Slider ⊕: The ⊝ & ⊕ buttons and slider provide a way to zoom in and out incase your mouse does not have a scroll wheel. The minus (−) button zooms out. The plus (+) button zooms in. The slider (between the two buttons) is a quicker way to adjust the zoom level.
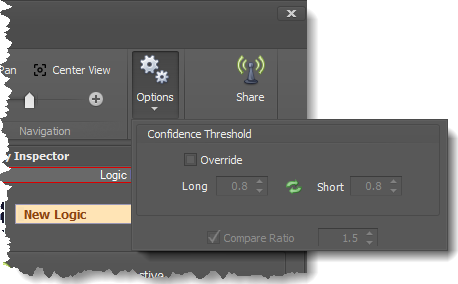
 Options button: This button provides easy access to override the Confidence Threshold values. These settings allow each logic template to have a its own Confidence Threshold values, for generating signals when using fuzzy logic. To learn about the Confidence Threshold values see the BloodHound Output section and the Properties section immediately below. To learn about fuzzy logic see the How BloodHound Works page.
The Confidence Threshold setting can also be accessed by selecting the Result node, and then in the Property Inspector panel select the Options tab.
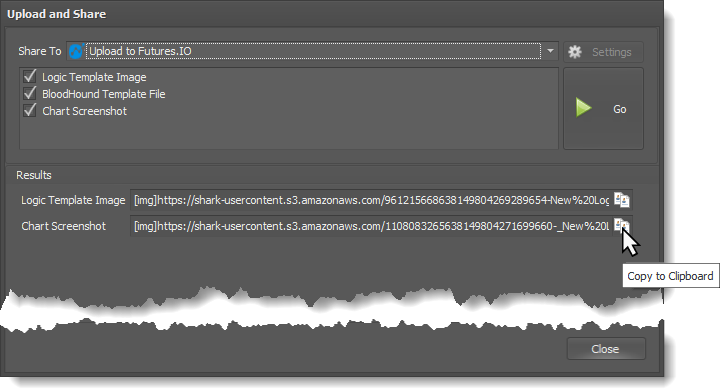
 Share button: This button opens the Upload and Share window. This provides text that is ready to copy & paste into most discussion forums making it easier to share screenshots of your system and BloodHound template file.
Solvers Panel
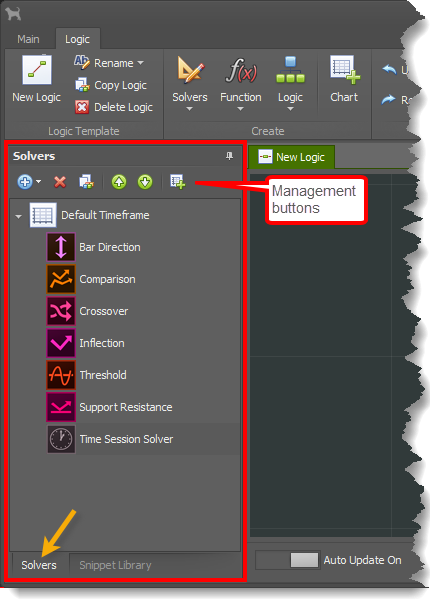 This panel holds a master list of all the solvers, and where Chart data series(secondary timeframes) are managed. If the Snippet Librar panel is visible, click on the Solvers tab at the bottom to switch to this panel.
Buttons
Add: This is an alternate location that adds new solvers to the Solvers panel only. When a solver is added via this way it must be dragged on to the Logic Board in order to use it in a system.
Delete: This deletes the selected solver or Chart.
Duplicate: This creates a copy of the selected solver or Chart.
Up: This moves the selected solver up from a lower listed Chart to a higher listed Chart. At least one Chart must have been added to the Solvers panel before a solver can be moved. This button does not move a solver higher to reorder the list within a Chart(timeframe). A solver can be dragged up or down to reorder its position within a Chart.
Down: This moves the selected solver down from a higher listed Chart to a lower listed Chart. At least one Chart must have been added to the Solvers panel before a solver can be moved. This button does not move a solver lower to reorder the list within a Chart(timeframe). A solver can be dragged up or down to reorder its position within a Chart.
Add Chart: This provides a way to add secondary Data Series (chart data) to the Solvers panel, for developing a multi-timeframe / multi-instrument system. Solvers can be moved to a Chart which runs the indicator used in the solver on that Chart data, and price data used in the solver also comes from this Chart.
Snippet Library
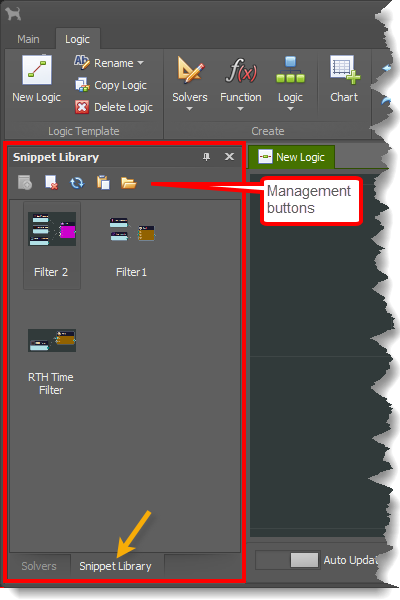 This panel displays all the snippets, and the management buttons, such as Add and Remove. If the Solvers panel is currently visible, click on the Snippet Library tab at the bottom to switch to this panel
To change the name of a snippet simply double-click on the name, and that will highlight the name indicating is ready to be changed.
Snippets are stored as two files. An XML data file of the nodes, and an image file. Think of the XML data file as a mini-BloodHound file. The image file just provides a visual element in the Snippet Library panel. The files are saved inside the NinjaTrader file directory, and the Snippet Folder button allows you to see the files.
Buttons
Add Snippet: This button creates a snippet from the nodes selected in the Logic Board. Newly created snippets are listed in the Snippet Library panel with the name highlighted, indicating it is in edit mode, and ready to be changed.
If nodes are not selected, the button is disabled.
Remove Snippet: This deletes the selected snippets. Deleting a snippet can not be undone.
Refresh: This rescans the snippet file directory on your computer's hard drive, and refreshes the list of snippets. This is normally not necessary, but because snippets are saved as files, those files can manually be moved, copied, renamed, or deleted via Window's File Explorer. If that is done, a refresh may be needed. Use the Snippet Folder button to open the snippet file directory in File Explorer.
Insert Snippet: This inserts the selected snippet into the visible Logic Board. As an alternative, a snippet can be dragged onto the Logic Board to more precisely choose its location.
Snippet Folder: This opens the Window's File Explorer to the snippet file directory location. Snippets are stored as files. Those files can manually be moved, copied, renamed, or deleted. These files can be shared with friends or your other computers, simply by copying them to the snippet file directory.
Where to Copy/Save Snippet Files
Logic Board
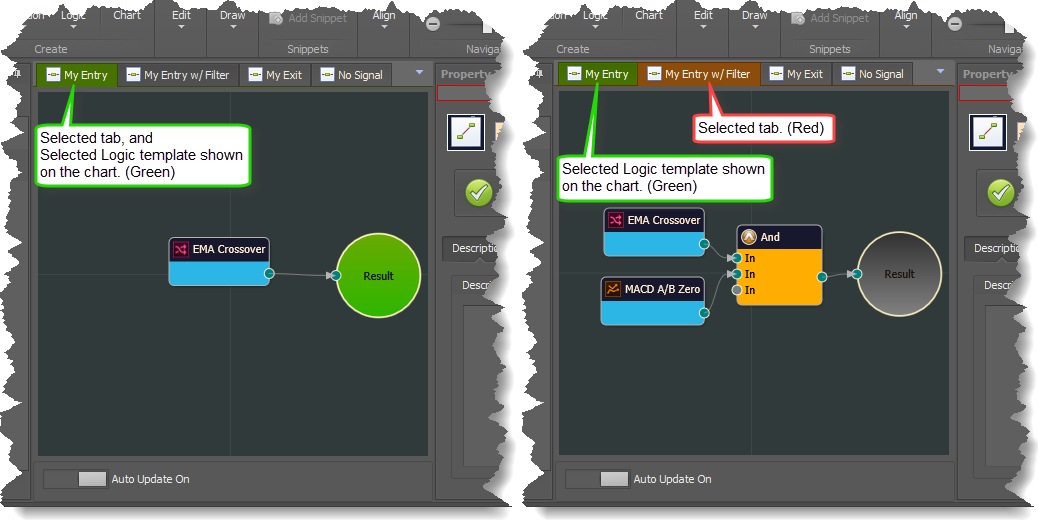
This area is where the system is built. Each system or derivatives of the same system are created in different Logic Templates. Logic Templates are displayed as tabs along the top. Click on a tab to switch between Logic Templates. Logic Templates hold different systems.
e.g. The primary system is usually the Entry signals (left green tab in image below). A secondary system could be Exit signals (third tab from the left in image below). Or, a secondary system could be a derivative of the Entry signal for instruments with higher volatility in which case indicators used in the system need different settings, such as going from an EMA(10) to an EMA(15), to compensate for the higher volatility. Or, maybe using different trend filtering indicators (red tab in image below).
The display order of the Logic Template tabs can be dragged to the left or right, allowing the order to be customized.
Green colored tab: This identifies the Logic Template being calculated and displayed on the chart. If there is no red tab, then this is also the Logic Template being viewed. The Result node will be green as well.
Red colored tab: This Identifies the Logic Template that is being viewed, but not the Logic Template being calculated and displayed on the chart. The Result node will be gray.
Green colored Result node: This identifies the Logic Template being calculated and displayed on the chart.
Gray colored Result node: This means the selected Logic Template is not calculated and displayed on the chart.
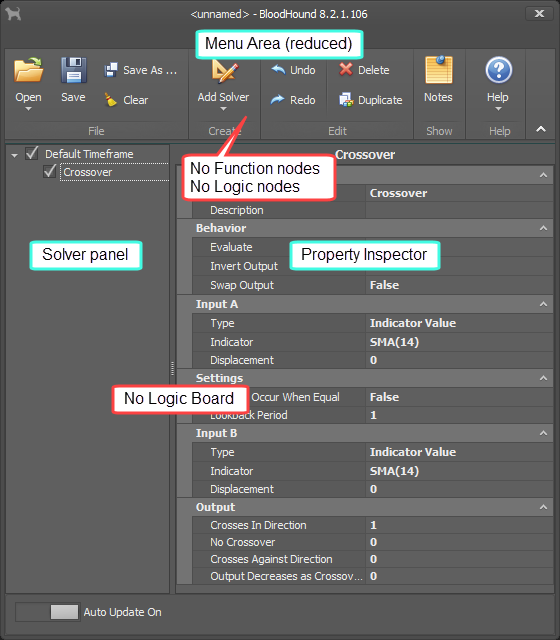
Property Inspector
 This panel displays information and all the various settings of the selected node. This is were node settings, and settings for other elements are changed.
The horizontal yellow area at the top shows the name of the selected node, and is where the name can be changed.
The panel typically shows three tabbed section, Properties, Options, and Help.
The Properties tab contains the essential settings for all nodes.
The Options tab contains extra secondary settings common to all nodes.
The Help tab displays the documentation page (from this web site) of the selected node.
Please note: NinjaTrader v8.0.26.0 or newer is required for the built in web viewer to work, and thus the documentation to be displayed.
AutoSave and Semi-Automatic Loading
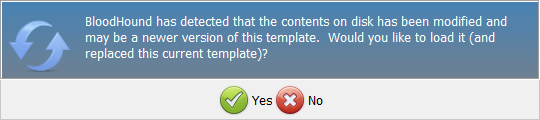
Semi-Automatic Loading: Semi auto file loading only occurs if the file's timestamp has been updated, and a chart reload is required to initiate the autoloading. BloodHound records the file's timestamp whenever it loads a file, or saves to the file. As a practical matter, semi-autoloading will only be invoked if the same template file is open in other instances of BloodHound and edits to the system are being saved.
Newer Version Notification. This pop-up window will occur when BloodHound detects the file's timestamp is newer. It provides a quick and convenient way to load the newer file. Keep in mind, sometimes false positives may occur, because nothing of significance was saved tduring an auto save .
Important note: If two or more interface windows are open and they have the same template file loaded, a data feed connection will cause all charts to reload at the same time. If this occurs, every BloodHound with an open interface window will all try to auto save at the same time, but the last BloodHound that is shut-down/reloaded by NinjaTrader, is the last one to auto-save to the file. Not necessarily the BloodHound with the new changes. A BloodHound with an older system in memory could be the last one to save, thus overwting the new changes. NinjaTrader determines the order in which each indicator is shut-down/reloaded. And, it is random each time.
Whenever you edit/change a BloodHound system, be sure to load the new changed into the other BloodHounds as soon as possible. When a newer template file exists, opening the interface will pop-up a dialog window asking to load the new file, making the process easy and quicker.
BloodHound v1
Summary
The interface consists of two main areas.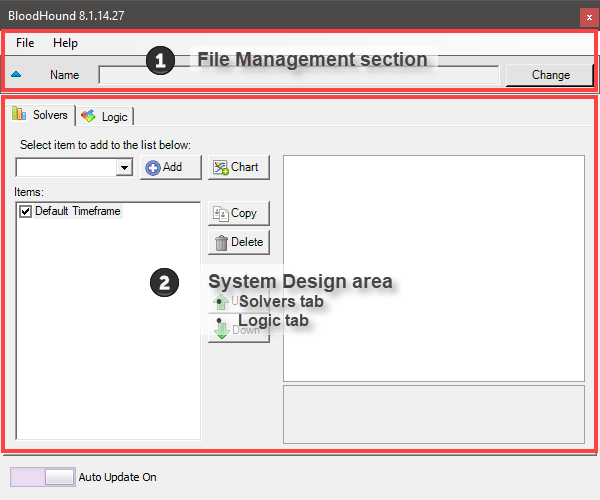
![]() File Management section.
File Management section.
This area displays the name of the loaded template file, and has standard File and Help drop-down menus.
![]() System Design area.
System Design area.
This area is were your system is built. Referred to as the system logic. Various components of this area are disabled in the Pro and Standard editions of BloodHound. See section BloodHound Editions if you have the Pro or Standard edition.
Close window button. The Close button (red "X" at the top right) closes the interface window and also saves to the file. Any action that causes the BloodHound window to close (i.e. anything that causes a chart reload) also causes an automatic save to ensure changes are not accidentally lost. This is similar to an autosave feature.
Closing the interface does not perform an automatic load check.
The System Design area is divided into two sections. The Solvers tab, and Logic tab.
 The Solvers tab is a master list of all solvers, and where secondary chart Data Series/timeframes are managed. Solvers can be copied, deleted, or moved to different Data Series.
 The Logic tab is were more complex systems are built. The Logic template menu can be used to create many different systems all saved in the same template file. Or, variations of the same system (e.g. different indicator settings for different instruments, or different setting for different types of market behaviors). Variations of the same system is the recommended use.
File Management Area
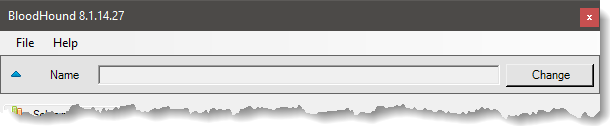
This area displays the name of the loaded template file, and has standard File and Help drop-down menus. Click the images to enlarge.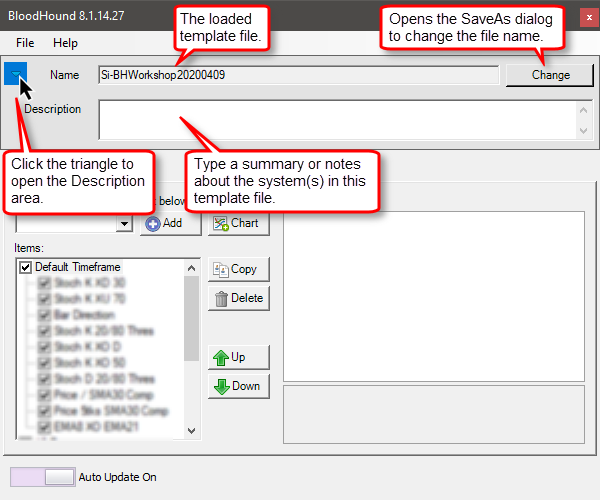
The Change button on the right is a quick way to open the Save As dialog window to change the system's file name.
The green triangle button will open the Description area. This area is for writing a summary or notes about the system as a reminder. Click the green triangle to open or collapse this section.
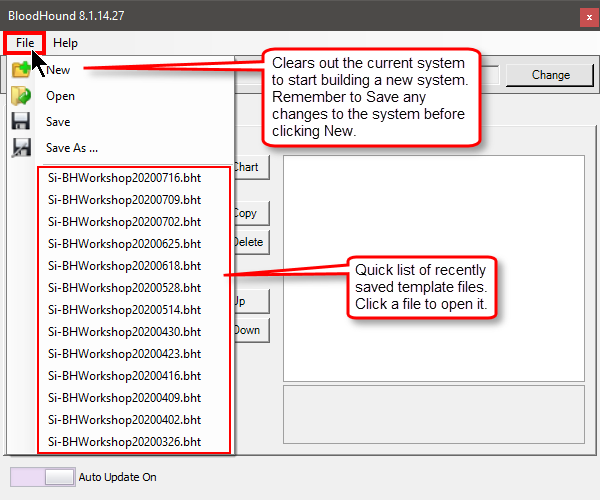 File dropdown menu. This is where you can open, save, or start a new system. BloodHound is unlike any indicator you have used before. Think of BloodHound similar to a Microsoft Excel spreadsheet. You fill the spreadsheet with formulas and data, and then save your work to a file so you can use the spreadsheet again at a later date. It is the same with BloodHound. You save your system/work to a file so you can use it again after shutting down NinjaTrader.
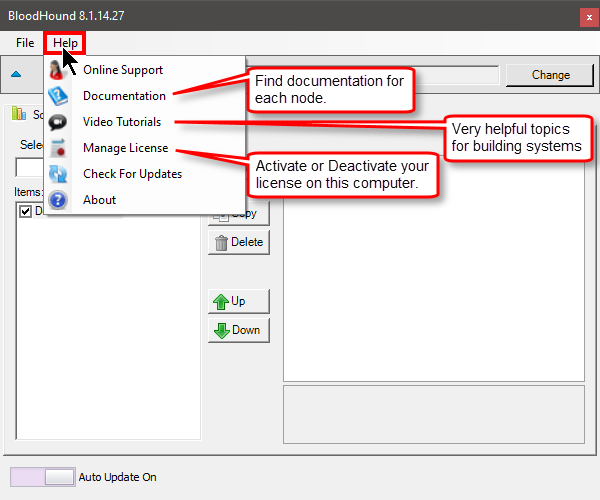 Help dropdown menu. This provides quick links to various training documents and videos, licensing management, and you can manually check for updates. BloodHound does automatically check for updates every few days.
System Design Area
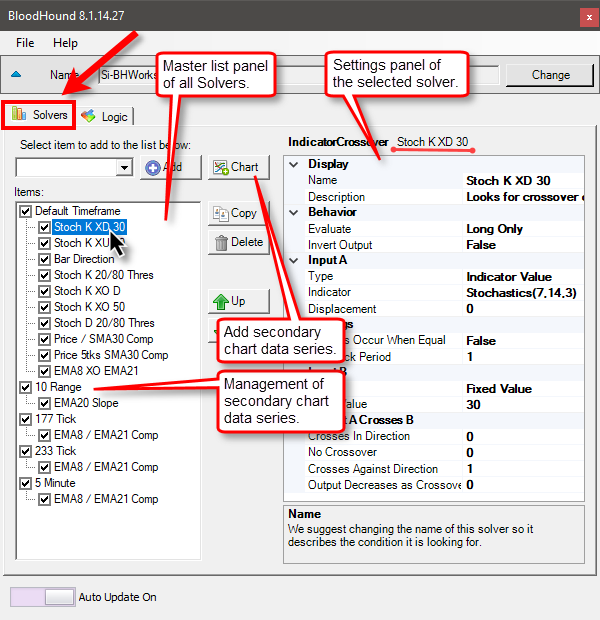
The Solvers tab
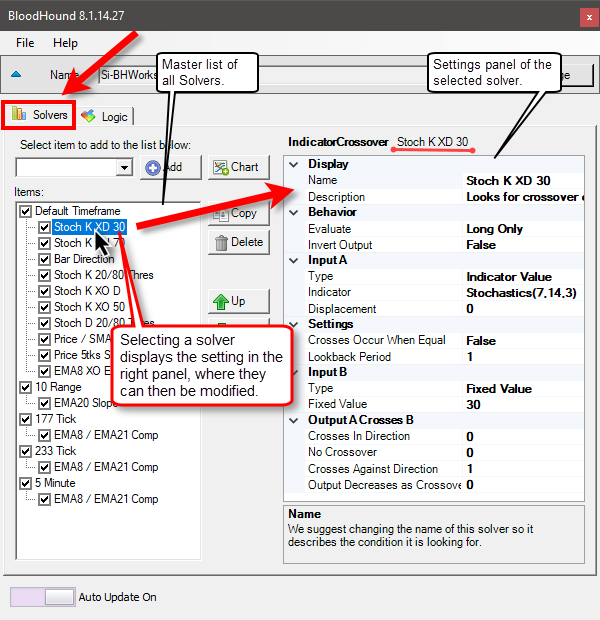 Left and right panels. The left panel is a master list of all the solvers and Data Series(timeframes). The right panel displays the settings of the selected solver or Data Series, where they can be edited.
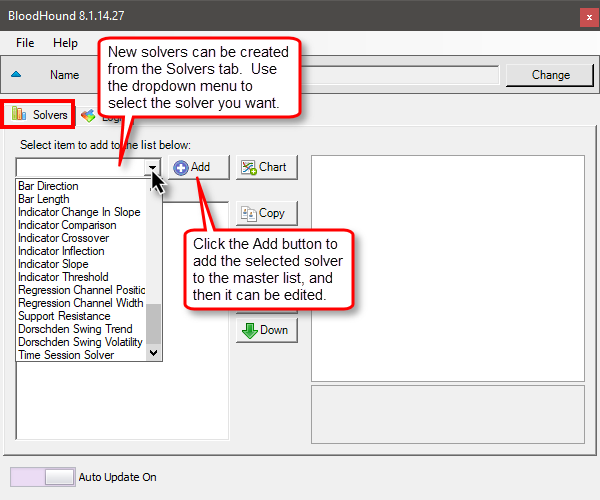 Solver dropdown menu. This menu is used primarily by the BloodHound Standard edition users. For BloodHound Ultimate edition users, when you become proficient in building systems you might start creating solvers here first. Then add them to the logic board and connect them up afterwards.
 The Buttons.
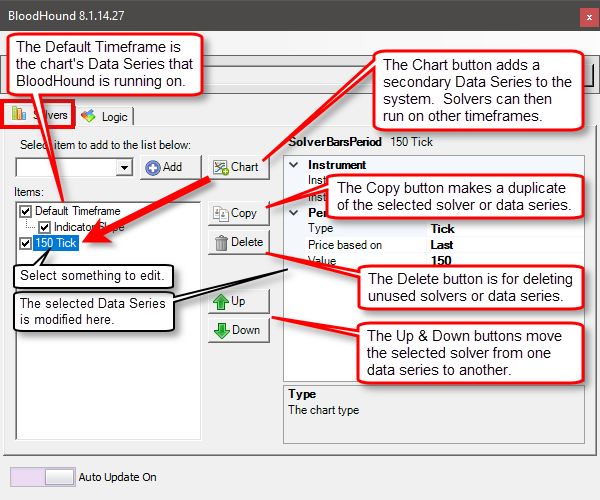
The Chart button will add secondary Data Series (commonly referred to as a timeframe) to the system.
The Copy button will make a duplicate of the selected solver or chart (data series). This is handy for quickly making a new solver that is very similar and only needs a few changes.
The Delete button is for removing unnecessary/unused solvers or data series. As your system progress and changes are make, there may be solvers that are no longer being used and are unnecessary. It is good practice to delete those solvers. That will help BloodHound run faster.
The Up & Down buttons are for moving solvers from one data series to another data series. It is not for organizing solvers into a specific order.
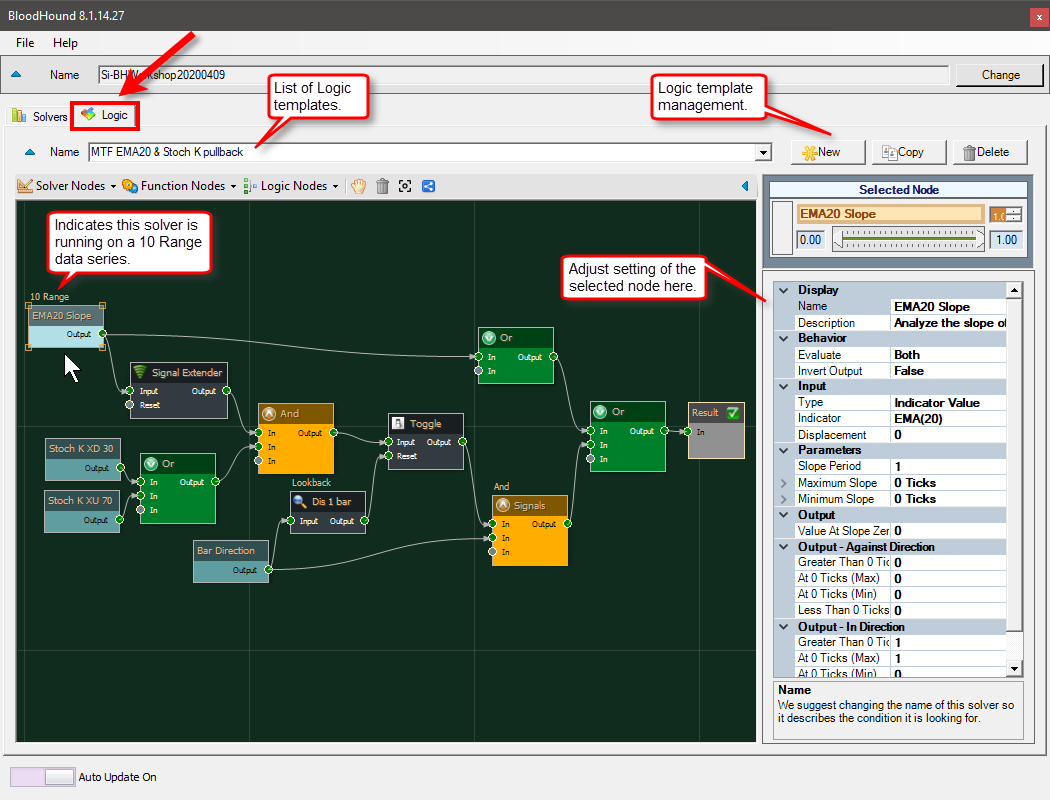
The Logic tab
 The green triangle button will open the Description area for the selected logic template. This area is for writing a summary or notes for that specific logic template.
The Overwrite Confidence Threshold option on the right side allows each logic template to have a its own confidence threshold values, for generating signals, when using fuzzy logic. To learn about the confidence thresholds see the BloodHound Output section. To learn about fuzzy logic see the How BloodHound Works page.
Click the green triangle to open or collapse those areas.
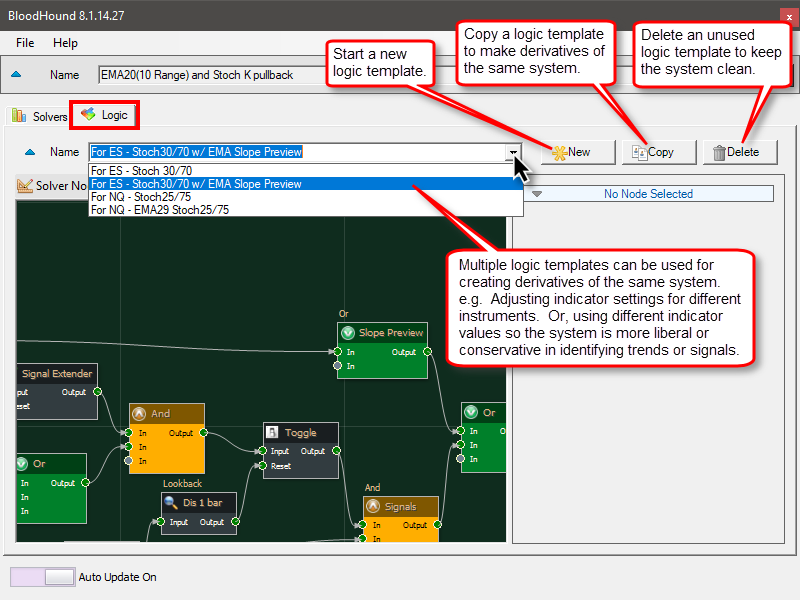 The Logic Template dropdown menu opens the list of logic templates. Within each BloodHound (template) file, multiple logic templates can be created. Each logic template is a separate system. Logic templates are not linked together. i.e. Their outputs do not affect each other. They can share/use the same solver, and therefore changing the settings of a shared solver will change the results of both logic templates.
Best Practice: Using multiple logic templates is best for creating derivatives of the same system. e.g. The MACD indicator calculates different values for each instrument, thus if a system is looking for extreme values in the MACD, those extreme values will be different for each instrument. So, once you have a system built for one instrument you can make a copy of the logic template and a copy of the key MACD solver. And then, adjust the new logic template by replacing the MACD solver with the copied one that is adjusted for another instrument. Another common example is traders will use different indicator settings for different instruments, to adjust for differences in volatility between instruments. In this case, copies of key solvers are created and each solver will be setup with the different indicator settings for each instrument.
Not Recommended:
To keep your systems better organized, it is bad practice to build a trend following system, counter trend system, and break-out system all in the same template file. It will be easy to forget all the systems within the various template files you will eventually create.
The New button is used to create/start a new and blank logic template.
The Copy button creates a duplicate of the selected logic template. The new copy then should have the logic template name adjusted, and then adjustments to the logic/system can be made. See Best Practice above for practical examples for using the Copy button.
Also see "Logic Template dropdown menu" above for important information about shared solvers.
The Delete button will deleted the selected logic template. Keep your system lean and remove logic templates that will no longer be used or needed.
 The Solver Nodes, Function Nodes, and Logic Nodes dropdown menus is how nodes are added to the logic board.
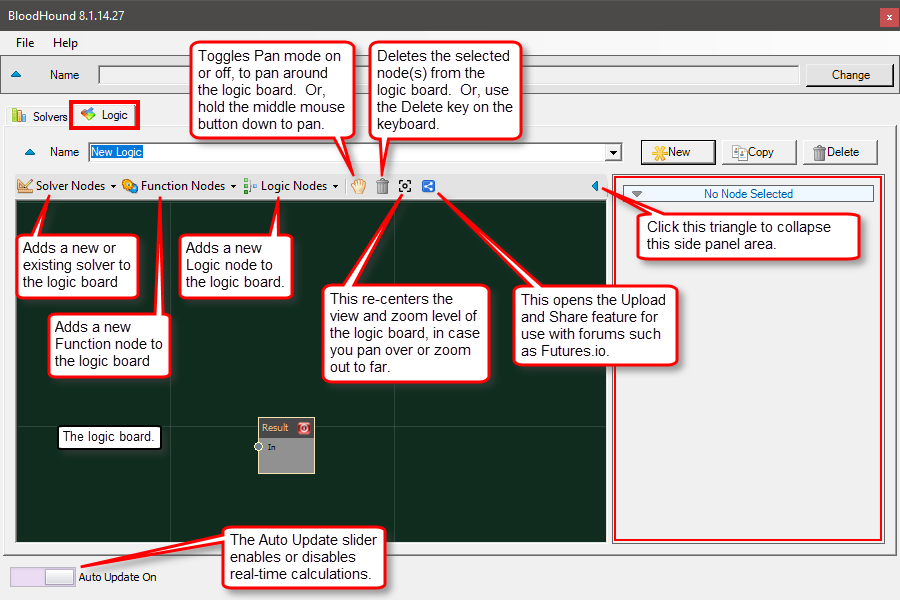
The Hand button toggles pan mode on & off. The logic board can be panned from side to side to access more of the boards area. If your mouse has a middle button, press and hold it down to activate pan mode.
The Trash Can button deletes all selected nodes. Also, the keyboard's Delete key will delete selected nodes. Solver nodes are only removed from the logic template. They still exist in the Solvers tab. Solvers can only be permanently deleted by using the delete button on the Solvers tab. Function and Logic nodes are permanently deleted.
The Recenter View button restores the default viewing area, as seen when creating a new logic template.
The Upload and Share button provides an easy way to share a screenshot of the logic template, as is currently being viewed, a screenshot of the chart that BloodHound is running on, and the BloodHound template file.
The green triangle on the right will collapse the setting side panel to increase the viewing area of the logic board.
The Auto Update slider button toggles automatic calculations on or off. If making changes to your system is taking a long time to update, then set Auto Update to off. Make the changes/edits you want and use the Apply button, on the right side, to perform a single recalculation. When finished editing, turn Auto Update back on.
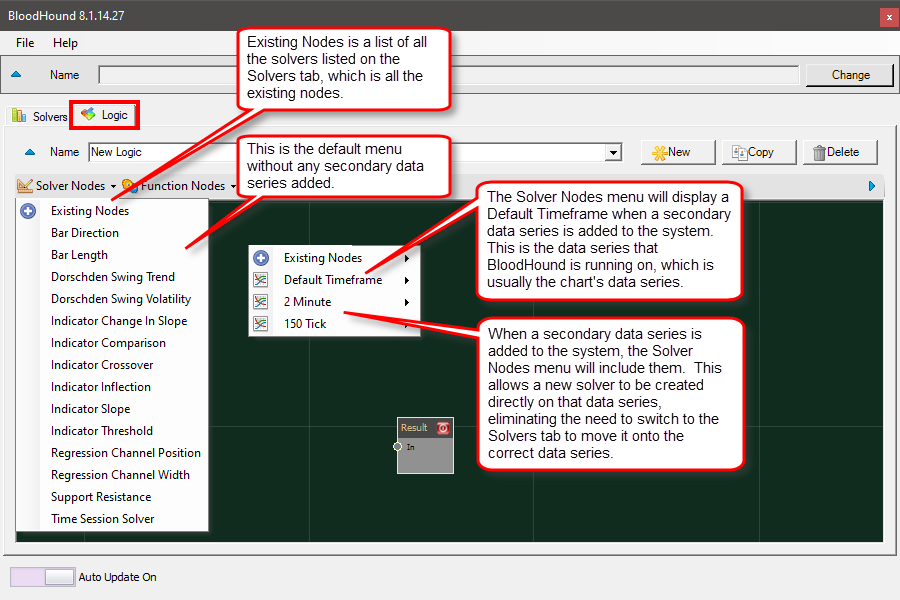 The Solver Nodes dropdown menu will automatically update to display all the data series added to the system. This allows a new solver to be created directly on the secondary data series without having to switch to the Solvers tab to move the new solver onto the correct data series.
BloodHound v1 Editions
Standard vs. Pro vs. Ultimate
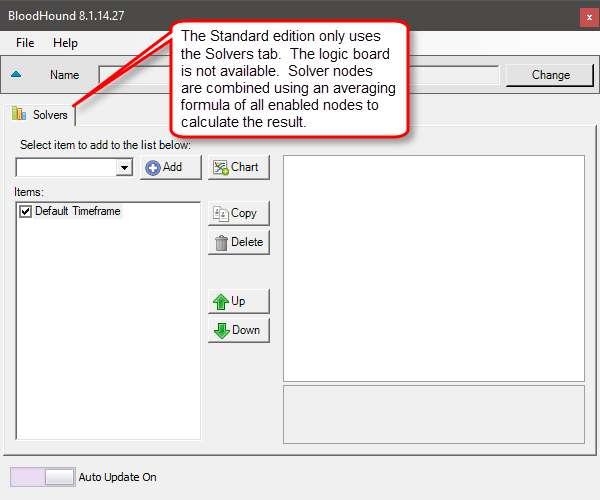 The Standard edition utilizes the Solvers tab interface only. The Logic tab is unavailable. The final output/result is calculated by taking the outputs of all enabled solvers and combining them together using an averaging formula. The Standard edition is where the check boxes for each solver is meaningful.
Click images to enlarge.
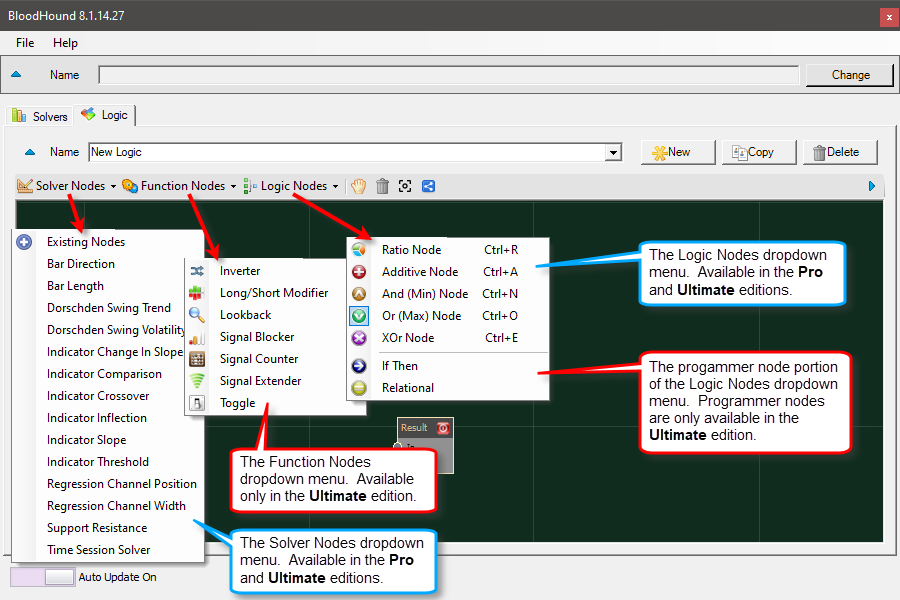 The Pro and Ultimate editions are far more powerful due to the capabilities the Logic tab offers. The Pro edition does not have Function nodes or the Programmer nodes.