
Multiple Time-Frames / Data Series
BloodHound is capable of performing its analysis on multiple time-frames, allowing you to derive a final result from observations outside the chart that BloodHound is running on. For instance, your trade system rules may require a larger time-frame chart to determine the overall trend of that instrument. BloodHound can incorporate multiple time-frames or charts within your calculations, allowing you to pool data from many sources that would otherwise be difficult to track manually. For the purposes of this documentation, we will use the term time-frame and chart interchangeably.
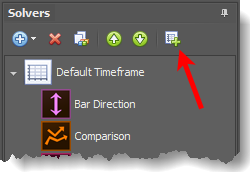
BloodHound allows you to assign any of your solvers to any time-frame (a.k.a. chart). Charts are added to BloodHound from the Solver panel by clicking the Chart button.
Comparing One Time-frame to Another:
Solvers that have two Inputs (Input A & Input B), such as the Comparison and Crossover solvers, have both Inputs running on the assigned time-frame. The entire solver is using chart data from the assigned time-frame. i.e. Input A can not be assigned to a different time-frame from Input B.
e.g. Lets say BloodHound is running on a 1 Minute chart. If you want to compare the 1 Minute SMA to a 15 Minute SMA, you would load the "regular" SMA into Input A. For Input B, you must use a custom built 15 Minute SMA that calculates the 15 Minute SMA no matter what chart it is running on.
Adding Time-Frames/Charts
 BloodHound v2:
In the Solvers panel, click the Chart button (right image) and specify the chart type in the Property Inspector panel (below image. Right-side panel in the BH window). 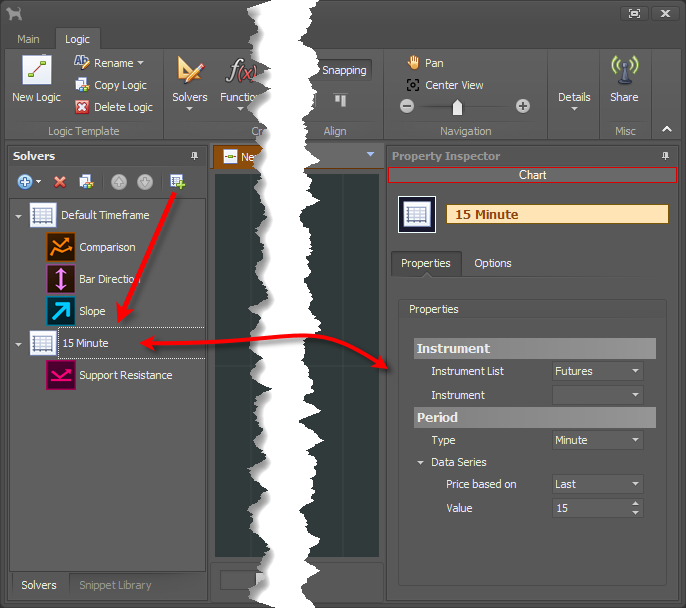
BloodHound v1 (old):
Under the Solver tab, click the
When BloodHound first starts up or is reloaded, the charts you have specified will load internally once NinjaTrader loads the Data Series. Note: this action does not open NinjaTrader charts on your screen, but instead will ensure that the additional chart data is loaded and factored into BloodHound’s calculations internally. Therefore, in order to visualize the charts you must open a new chart (matching the Chart created in your BHT) as you would normally with NinjaTrader. Also note that custom chart types (that is, any chart type that isn’t a NinjaTrader system chart) possibly may not be supported by BloodHound. The vast majority are supported.
Once you have added a Chart, solvers can be moved from one chart to another by using the Up or Down Arrow buttons. Also, when creating a new solver, there is a choice of which chart to create the new solver on.
Default Timeframe: The Default Timeframe is always listed at the top of the Solvers panel, because it always represents the chart that BloodHound is running on. Thus solvers listed directly under the Default Timeframe run on the chart that BloodHound is running on.
e.g. If you add a Bar Length Solver to the Default Timeframe, and BloodHound is running on a 1000 Tick chart, that solver will measure the bar length of the 1000 Tick bars. Alternatively, if you add a Bar Length Solver to a 5 Minute Chart, that solver will measure the bar length of the 5 minute bars, and thus incorporate the 5 minute bar length into BloodHound's calculations. Similarly, solvers using indicator data as their Input, the data received is calculated from the indicator running on the 5 Minute chart. Even though, BloodHound may be running on a 1000 Tick chart.
Historical Data On Time-Frames
NinjaTrader v7 has a known issue working with multiple timeframes that has not been corrected. This issue happens randomly.
Here is a brief explanation of the Ninja issue: Think of BloodHound as the parent indicator, and SiChameleon or any other indicator you load into BloodHound as the child indicators. The issue occurs when the child indicator loads its own secondary/alternate time-frame data (i.e., such as a custom SMA indicator that uses 5 minute chart data to display a 5 Minute SMA on any chart you want). NinjaTrader may not load the SMA’s 5 minute data correctly inside the child indicator. When this happens NinjaTrader will not calculate the child indicator, and therefore skips bars.
Tick Replay
Tick Replay compatibility is a fickle topic. SharkIndicator has followed NinjaTrader's documentation to ensure BloodHound itself is T/R compatible. Once guest indicators are introduced that is when things become fickle. For example, SharkIndicators has tested many systems using stock NinjaTrader indicators (e.g. OrderFlow Cumulative Delta, VWAP , ATR, CCI, Current day OHL, Darvas, Fisher Transform, Parabolic SAR, etc.) on different bar types, using different Calculate setting, and the systems calculate correctly.
Where full compatibility may be fickle is when using 3rd party indicators. There is no way to know if a 3rd party indicator was fully tested by the author to run inside another indicator (as a guest indicator). Hopefully, the 3rd party indicator was tested on a chart for T/R, but probably was not tested as a guest indicator for building an automated or more complex system, as BloodHound is designed to do.
Video Examples
This comes from our Getting Started video series.