
Confidence Solvers
Confidence solvers are necessary building blocks for arriving at BloodHound’s final output. They detect fundamental conditions in price action and indicators. There are many different solvers included with BloodHound, some of which analyze indicator behavior (such as slope or cross-over events between indicators), price bar characteristics, closing price against support and resistance, or price swing patterns. All solvers perform an evaluation for both the long and short side for each incoming tick and price bar. These evaluations result in a number between 0 and 1.0.
Solvers provide the source data for your logic. Typically you would employ multiple solvers, each examining various aspects of your charts. Solvers can also be assigned to different time-frames other than the one that BloodHound is actually running on, allowing you to include factors from charts outside the current time-frame. For more information on how solvers fit in the big picture, review the article on How BloodHound Works, or review our Quick Start Guide video.
Establishing Criteria
Before implementing anything in BloodHound, it is often best to first articulate which aspects of your chart and indicators influence your desired output; be it trade signals, setups, filters or whatever your main goal may be. For example, when designing a trading system, start by writing out in detail your signal rules on paper. From that set of rules you will then be able to determine which aspects of your chart, or charts are pertinent to your signals.
It is important to be specific, for example if your system requires the use of a EMA(50), you need to articulate what aspects of the EMA(50) are of interest to you. Is it the change in slope? Is it the relationship to the current price? Is it used as some form of support or resistance? Articulating its specific use will help you determine which solvers are actually required for your analysis.
For the purposes of constructing an example, let us consider the statement “slope of the Stochastic D Indicator is good” as one of your criteria. Suppose that “good”, for the purposes of your system means a positive slope for the long side, and negative slope for the short side. Recall that solvers make evaluations on both the long and short side. To accomplish this, we can configure an Indicator Slope Solver to give us a favorable output value (that is a high number) when the “slope of the Stochastic D Indicator is good” for a particular side. This can be done by configuring an Indicator Slope Solver (with the Stochastic D indicator selected) to produce an output of 1.0 when the slope is positive when evaluating the long side, and produce an output of 1.0 when the slope is negative when evaluating the short side. Indeed the default behavior of the Indicator Slope Solver is already configured to do this.
Adding Charts (Timeframes)
BloodHound uses the term Chart, instead of time-frame, because BloodHound can pull-in market data from other instruments. While you were articulating your criteria, you should also list the various Charts(time-frames) you need to examine, if applicable. Your system may need to examine other Charts than just the chart BloodHound is running on. The chart BloodHound is running on is labeled Default Timeframe in the Solvers panel. You will notice the Default Timeframe can not be changed, obviously because the BloodHound indicator can not change the Data Series settings of the chart it is running on.
NinjaTrader uses the term Data Series.
To add Charts to your system, open the BHT window.
BloodHound v2: Navigate to the Logic tab, which should already be selected by default. For every additional chart needed click the Chart button (middle left area) and then specify the chart type in the Property Inspector panel (right hand panel).
BloodHound v1: Navigate to the Solvers tab, which should already be selected by default. For every additional chart needed click the ![]() button and specify the chart type in the right hand pane (much like you would when using the NinjaTrader » Data Series window).
button and specify the chart type in the right hand pane (much like you would when using the NinjaTrader » Data Series window).
Adding Solvers
Once you have finished adding charts, you will need to add the appropriate solver(s) by comparing your system design requirements to the list of solvers below. Note, sometimes a single criteria may require an aggregation of solvers to represent it. If that is the case, simply add all the solver’s needed, and you can “wire” them together (typically with a AND node) on the Logic Board appropriately.
Click the Solvers menu and select a solver to add it to the system. Add as many as necessary. Move them under the appropriate time-frame, if applicable by using the Up or Down Arrow buttons. The order that you add the solvers is unimportant. You can also add a solver directly to a specific Chart by selecting the Chart first in the left hand list before adding the solver.
Solver Types
Common Solver Settings
Name
The name allows you to specify a friendly identification or function the solver does. This name will help you identify the solver in the Logic Board.
Description
You can use the description to create a custom comment for your solver. Descriptions are used to remind you what your chosen solver’s intended purpose is. Liberal use of descriptions is recommended to help keep a complex configuration manageable.
Enabled
Solvers can be enabled or disabled only when used on the Solver tab. When disabled, the solver will not affect the output. BloodHound will behave as if the node does not exist. You can use the disable feature if you need to remove solvers from the output to analyze how BloodHound is producing an unexpected result. When a Logic template (Logic tab) is created this setting no longer has any effect and permanently behaves as set to True. In this case, to disable a solver on a Logic template, delete the leader. A less preferred way to enable/disable a solver is use the Weight Slider Controls.
Evaluate
Solvers can be configured to evaluate only one side (the long side or short side), instead of evaluating both sides simultaneously for every bar (the default behavior). This is useful if you have criteria for the long and short side which are very different or you need to implement the long and short logic separately. This may be necessary if your long and short logic is very different from each other.
Invert
The inversion setting allows you to invert the output of the Solver to give you the opposite effect of its regular behavior. The inversion option performs a fuzzy logic inversion taking the original output and apply the formula (1 – x, where x is the original output) to it. It is the equivalent of applying a NOT fuzzy logic hedge to the solver node.
Data Type Selection
Most solvers allow you to select the type of Input data that the solver will analyze. These solvers include:
- Change In Slope
- Comparison
- Crossover
- Expansion Contraction
- Inflection
- Slope
- Threshold
- Support Resistance
Each of these solvers has at least one section labeled Input A followed by a selectable drop down labelled Type. By default, this is set to Indicator Value allowing you to use an indicator’s plot as the input data to analyze. However, by clicking the drop down you will see there are actually 6 choices in total: Fixed Value, Price, Volume, Indicator, Swing Point Prices, & Linear Regression Channel.
Fixed Value
Fixed Value allows you to specify a single value that never changes. This may be useful for instances when you require a fixed threshold, particularly with the Indicator Comparison, for detecting low volume. Say for instance, 100 shares per bar. 100 would be the fixed value to compare against the Volume indicator. Note: using Fixed Value setting does not make sense with slope based solvers such as Indicator Inflection, Indicator Slope or Indicator Change In Slope.
Price
This option allows price data to be used by the solver. The price data can be manipulated by the various settings before it is used by the solver.
Note: BloodHound does not perform custom mathematical calculations, thus if you need to manipulate bar prices, a custom indicator will be needed.
Custom Prices
Body Top: Regardless of the bar direction, this returns the higher price of the candlestick body. Either the close or open price. Whichever is the top. e.g. For an up bar, the Body High equals the close price.
Body Median: This returns the median price of the candlestick body. The formula is (Close + Open) ÷ 2.
Body Bottom: Regardless of the bar direction, this returns the lower price of the candlestick body. Either the close or open price. Whichever is the bottom. e.g. For an up bar, the Body Low equals the open price.
Volume
As the name implies, Volume uses the bar volume as the solver Input. This is simply a short cut to loading the NinjaTrader VOL indicator.
Indicator Value
This is the default setting and most commonly used Input type. This allows the selection of any installed indicator that has one or more of the following output types; a Plot or Series<T>.
A Plot is the plotted line or bar seen on the chart (e.g. the SMA line, RSI line, Volume bars, etc.), which always has a numeric value seen on the right or left edges of the chart.
A Series<T> is not visible on the chart. It contains data like a plot and is readable by BloodHound. A Series<T> can contain the indicator’s main value, extra secondary data/values, or sometimes a signal of some kind. Tip: A signal value is typically +1, 0, or -1.
Note: Some NinjaTrader indicators are Not readable, per NinjaTrader design.
Technical note for programmers: BloodHound can read Series<T> data types Bool, Int, Double, and Long.
Select Indicator window
BloodHound v2
 Clicking on the ellipsis
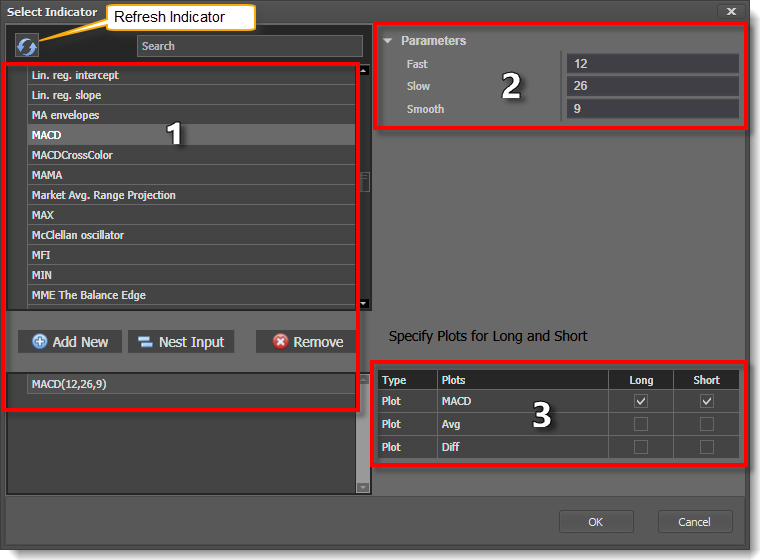
 ![]() button (to the right of the indicator) opens the 'Select Indicator' window. This window is used to;
button (to the right of the indicator) opens the 'Select Indicator' window. This window is used to;
1) Select the indicator
2) Set the indicator properties
3) Select the Plot or Output you want the solver to analyze.
Search box: Typing the first three letters of an indicator will create a shorter filtered list of indicators to quickly find the indicator you are looking for.
Refresh Indicator List button: This button is only used once after a new indicator has been installed. It initiates rebuilding an updated list of indicators. If the newly installed indicator does not listed, please see the next section below. Also, a menu item to perform this same task has been added to the NinjaTrader Control Center » Help menu » SharkIndicators menu.
Add New button: Instead of double clicking on an indicator to add it, this button can be used.
Nest Input button: This provides a way to feed the output of one indicator in to the input of another indicator (e.g. Smoothing the CCI by nesting/feeding it in to the SMA indicator). Watch this video for more info on the process… How to Perform Indicator Nesting Within a Solver
Remove button: Use this to remove nested indicator from the list (in the bottom area).
Select Indicator window
BloodHound v1
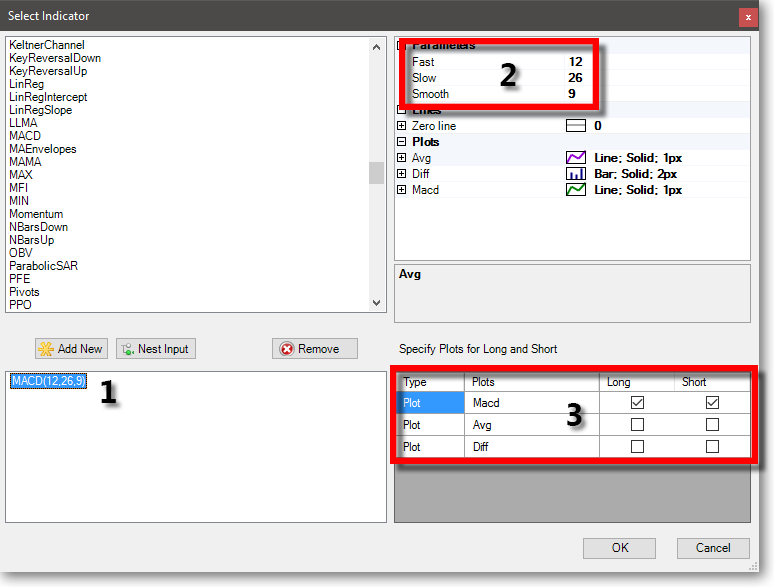
1) Select the indicator.
2) Set the indicator properties.
3) Select the Plot or Output you want the solver to analyze.
Indicators Missing From the List
If an indicator is missing from the 'Select Indicator' window, that means the indicator does not have a readable output or may have thrown an error when building the list. Or, the indicator may only draw information on the chart using custom graphics routines, which are not readable.
In order for BloodHound to read 3rd party indicators the developer must follow NinjaTrader’s Best Practices for 3rd Party Developers » Expose Indicator States. This video will help you determine if your favorite 3rd party indicator has an output that is readable… How to analyze custom indicators in BloodHound.
NinjaTrader Order Flow Indicator: Most of these indicators are not readable, per NinjaTrader design. As of Feb. 19th, 2025, only the O/F Cumulative Delta and VWAP indicators are readable.
Can Indicator Properties be Exposed to a NinjaTrader Window?
(for Optimization or simple changes to indicator settings)
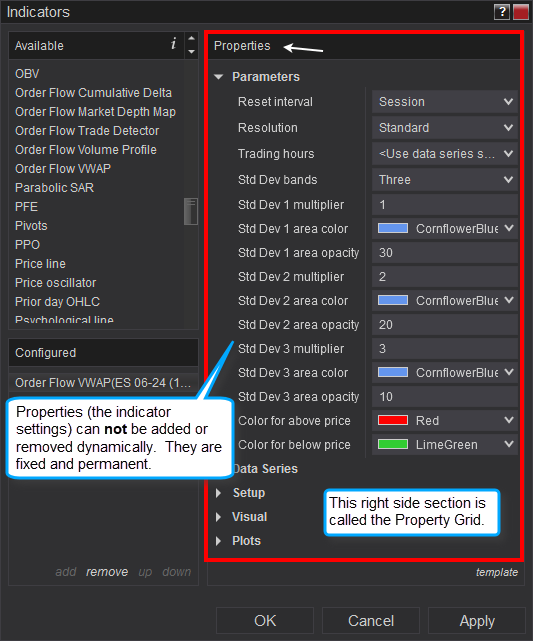 Currently, NinjaTrader uses a static property grid (seen on the right) for their Indicators window, and all other windows such as the Strategy Analyzer/Optimizer window. This means new indicator setting can not be added on-the-fly which is needed for the dynamic nature of SharkIndicators software that allows indicators to be added and removed on-the-fly. A new indicator version must be created in order for NinjaTrader to add or change the list of Properties. Therefore, the way NinjaTrader is currently designed, BloodHound is not able to expose indicator properties.
e.g. If your system uses the MACD, the Fast , Slow , and Smooth properties need to be listed in the property grid. But, later if you decide to remove the MACD and use the Momentum instead then the Period property needs to be added, while the Fast , Slow , and Smooth properties for the MACD need to be removed from the property grid. Unfortunately, NinjaTrader does not allow that. We hope a solution can be found in the future.
Displacement
The Displacement parameter works the same way as the NinjaTrader Displacement parameter. It is used to analyze indicator plot values from previous bars back. Setting Displacement to 5 will set the solver to use the indicator’s value from the 5th bar back. In effect, this shifts the indicator plot from 5 bars back to the current bar. For instance, suppose you want to analyze an indicator’s value 5 bars ago. Set the Displacement value to 5 and the solver will always use indicator data that is 5 bars in the past. The Displacement operates on the chart/time-frame the solver is set to.
Swing Point Prices
Swing Point Prices allows you to harness swing points for the input data. Using swing points will feed the price at which a top or bottom occurred in the past to the solver. This is useful for when you need to factor in the lowest low, or highest high from past swing point prices.
You can use the bundled indicator called Swing Highs & Lows to help visualize how BloodHound is identifying swing points on your chart. To do this, add the Swing Highs & Lows indicator to your chart directly (using NinjaTrader's Indicator window).
Start by specifying how many price swings you would like to analyze in the past. When utilizing the Swings setting, you can specify the type of swing data you are after by selecting Tops or Bottoms, and Widest or Tightest Swing for both the long and short side evaluations.
For example, suppose you need to identify the price point of Highest High of the past 5 price swings when doing the long evaluation, and the Lowest Low of the past 5 price swings when doing the short evaluation. First you would set Number of Swings to 5, restricting the solver to only look at the past 5 price swings. You would then set Long: Bottoms or Tops to Tops, and Long: Widest or Tightest toWidest. Similarly, you would set Short: Bottoms or Tops to Bottoms and Short: Widest or Tightest toWidest. The Widest setting will produce the furthest bottom or top found in the last number of price swings set by: Number of Swings. In contrast, using Tightest, will cause the solver to produce the price at which the Lowest High occurred (for a setting of Tops) and the Highest Low (for a setting of Bottoms), again within the past number of swings specified by Number of Swings. The table below summarizes the possible combinations:
Note: Using the Swing Point Prices as input does not make sense for slope related solvers such as the Slope, or Change in Slope solvers. The points is, not all data types are suitable for all solvers.
| Widest | Tightest | |
|---|---|---|
| Tops | Highest High | Lowest High |
| Bottoms | Lowest Low | Highest Low |
Linear Regression Channel
Selecting Regression Channel allows you to use the Regression Channel’s Upper, Middle, or Lower line as input to the solver. This may be useful if you need to compare an indicator or price to one of the channel lines. You can select which channel line to use as input for the long and short evaluations separately, with a choice of the Upper Channel Line, Middle Channel Line, or Lower Channel Line.
Note: Selecting Regression Channel for slope related solvers (Slope, Change in Slope, and Inflection solvers) do not have a channel selection since the slope for all channel lines are always the same. As you may expect, the slope of the channel line is what is evaluated, which is the same as using the 'Lin. reg. slope' indicator for the input.
Setting a Distance
BloodHound provides various units for setting a distance. When you specify a distance, you can elect to measure in Points, Ticks, ATR’s or Renko bricks.
Points
Points are the base unit of the underlying instrument, and for indicators that run in their own sub-panel (e.g. ADX, CCI, MACD, Stochastics, etc.). This is the fundamental unit of charting.
e.g. To express $0.50 in the CL futures instrument, you would set the value to 50 and the measurement unit to Ticks (CL futures have a tick size of $0.01).
Please Note: When setting up the Rules window in the Comparison, Expansion Contraction, Slope, or Threshold solvers, and using an indicator that plots in its own sub-panel(e.g. ADX, CCI, MACD, Stochastics, etc.), you will need to set the measurement unit to Points. Do not use Ticks, because those type of indicator do not move in tick increments.
Ticks
The Tick unit only applies when working on the price panel, and with indicators that are designed to plot on the price panel. A tick is the smallest amount/increment an instrument moves or trades at.
Forex: In NinjaTrader, a tick is 1/10th of a pip by default. NinjaTrader can be changed so a tick equals 1 pip within the Options settings.
e.g. To express $0.50 in the CL futures instrument, you would set the value to 50 and the measurement unit to Ticks (CL futures have a tick size of $0.01).
Please Note: When setting up the Rules window in the Comparison, Expansion Contraction, Slope, or Threshold solvers, and using an indicator that plots in its own sub-panel(e.g. ADX, CCI, MACD, Stochastics, etc.), you will need to set the measurement unit to Points. Do not use Ticks, because those type of indicator do not move in tick increments.
ATR and Renko Bricks
Both the ATR and Renko Brick setting for Measured In is useful for expressing a value in terms of number of bars. For example, suppose your trading criteria required you to find moments where two particular indicators where 5 “bars” apart in distance. You could accomplish this by using either the Renko Brick (if you were using a Renko Chart) or ATR setting for Measured In.
ATR: This measurement unit allows you to express a measurement in terms of the Average True Range bar size (determined by the ATR indicator). Since all chart types, except for Renko charts, have varying or undefined bar sizes, ATR’s are often used as a viable alternative to gauge the average bar size. The ATR setting works the same as the Renko Bricks setting with one exception – you can also specify the ATR Period that is used to calculate the ATR value. The longer the ATR Period, the more bars are considered when calculating the average bar size. A period that is too large may incorporate bars that are not typical of current market conditions, and a period too short may not include enough bars to get an accurate sample size to calculate an average.
Renko Bricks: This measurement unit only applies to original Japanese Renko charts. It allows a distance to be expressed in terms of the number of bricks. For example, suppose you had a Renko chart with the brick size set to 5, thus each bar is 5 ticks in length/height. A measurement of $0.50 (50 ticks for /CL or Stocks) is converted to 10 Renko Bricks. 50 ticks divided by a 5 tick brick size equals 10 bricks ($0.50 = 50 ticks = 10 Renko Bricks). Therefore, to express $0.50 in the preceding example, you would set the value to 5, and Measured In to Renko Bricks. Note, the behavior is unpredictable if you use the Renko Brick measurement on a non Renko chart or a Hybrid-renko chart.